 CallRail (2)
 Salesforce CRM (1)
Already have an account? Sign in
Sign up for free
Connect your datasources and instantly see your data in this template.
Creating your account...
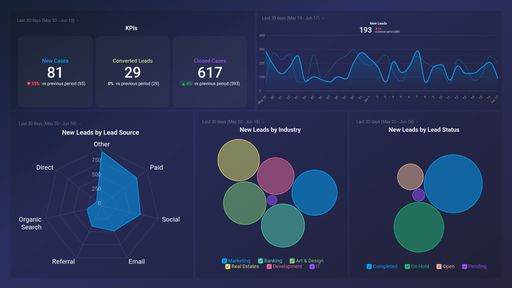
These call tracking dashboards come pre-built with some of the most commonly tracked sales KPIs and metrics from the most popular tools. You can also customize your templates later. To get started, just choose a template, connect your data, and your metric visualizations will populate automatically.
Try It Free
No design or coding skills necessary.
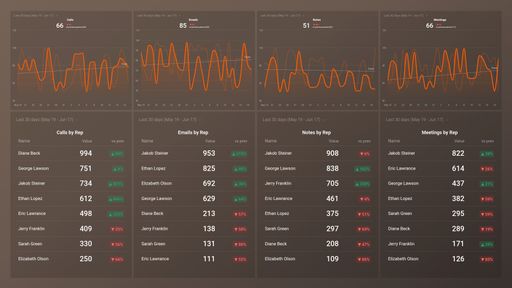
Learn more about Dashboard DesignerA call tracking dashboard gives you a holistic view of your sales team responsiveness to incoming and outbound calls (individually and collectively) and allows you to easily track your call volume and sales team activities at any given time.
Use the data gathered from tracking relevant call tracking KPIs and metrics to optimize your sales processes, and improve the performance and productivity of your sales reps.
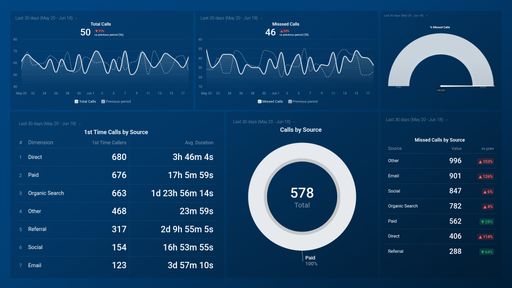
When building a call tracking dashboard, it is important to include the right call tracking metrics and KPIs. This will in turn, allow you to improve call efficiency, optimize your sales processes and performance over time.
The most important call tracking metrics you should be tracking are:


Compare
Databox Inc.
HQ: Boston, MA, USA
AI-powered analytics for teams that need answers now.
Databox Inc.
HQ: Boston, MA, USA

AI-powered analytics for teams that need answers now.


Compare
Connect your datasources and instantly see your data in this template.
Creating your account...