Sales Funnel

Free Sales Funnel Dashboard Templates

These sales funnel dashboards come pre-built with some of the most commonly tracked sales KPIs and metrics from the most popular tools. You can also customize your templates later. To get started, just choose a template, connect your data, and your metric visualizations will populate automatically.

Create your free Databox account

Track some of the most common Sales Funnel metrics and KPIs and analyze your Sales Funnel performance with just a few clicks.

TOP Sales Funnel INTEGRATIONS
  • HubSpot Marketing
  • Intrix CRM
  • Copper
  • HubSpot CRM
  • Pardot
Don’t see your SEO tool?
You can build a dashboard with any data using Zapier, Integromat, Google Sheets, or a SQL database.
A visual snapshot of monthly performance by the sales team.
HubSpot CRM
Sales and marketing funnel performance and conversion rate optimization effectiveness.
HubSpot Marketing HubSpot CRM
Pipedrive CRM dashboard template provides you with insights about opportunities, lost and won deals all to make sales more efficient.
Pipedrive CRM
HubSpot (Leads by Source) dashboard template gives insights on which sources of traffic drive the most leads or contacts. It explains where to focus marketing effort.
HubSpot Marketing
This dashboard shows the value of your company's current sales pipeline with a laser focus on what has closed this quarter. It also includes the expected value of the opportunities likely to close before quarter's end.
Salesforce CRM
Marketing & Sales dashboard template uses the Hubspot Marketing and Hubspot CRM products to give you a full view of both the top and bottom of your funnel.
HubSpot Marketing HubSpot CRM
This template gives you a complete overview of your leads in Salesforce so you can accurately track your sales progress.
Salesforce CRM
This template provides information to marketing and sales teams about their conversion rates, as well as giving a clear view of the full funnel and a detailed analysis of how the day-to-day is behaving based on when contacts entered different stages.
HubSpot Marketing
You can quickly gain insight into how your marketing and sales team is working together. See exactly where your leads are getting held up in the process, and develop a plan of attack to get them unstuck from your funnel.
HubSpot Marketing HubSpot CRM
HubSpot CRM Sales Drilldown: contacts, new deals, won, revenue, deals closed amount, all deals by source, deals created
HubSpot CRM
Sales Team Drilldown. View metrics by owner: emails logged, meetings booked, calls logged, average closed won deal amount, new deals created amount, close rate, closed won deals amount:
HubSpot CRM
This template tracks key data points to align sales and marketing and how you're maximizing the ascend stage of the Value Journey Canvas.
HubSpot CRM
The Convert dashboard helps you see how you’re doing in the subscribe and convert stages of the Value Journey Canvas.
HubSpot Marketing
This template was made for C-Level executives who want to track their Marketing and Sales teams KPI's.
HubSpot Marketing HubSpot CRM
This template gives you the ability to aggregate information from 3 HubSpot accounts. Using data calculations, we add together the core marketing funnel values.
HubSpot Marketing HubSpot CRM
Use this free dashboard template to track individual Sales Rep’s productivity and performance over time and against goals.
HubSpot CRM
Measure team performance, activity, and goal pace with this template. Keep track of Deal sources as you move through the closing stages.
HubSpot CRM
The HubSpot Marketing + Sales dashboard template uses data from both Hubspot services to show your full marketing funnel and sales pipeline.
HubSpot Marketing HubSpot CRM
This dashboard gives you an overview of your monthly forecast from Copper so you anticipate your new revenue.
Copper
Use this free dashboard template to view ratios between current traffic, leads, marketing qualified leads, deals, and customers.
HubSpot Marketing HubSpot CRM
This dashboard template, you're able to track your most important leads, monitor their growth, and reveal which campaigns have been most productive.
Pardot
This template provides information to marketing and sales teams about their conversion rates, as well as giving a clear view of the full funnel and a detailed analysis of how the day-to-day is behaving.
HubSpot Marketing
Email performance overview out of HubSpot
HubSpot Marketing
This HubSpot Marketing template allows you to compare last year's KPIs to this year's KPIs to your own personal goals. Simultaneously, it gives you the opportunity to share notes on key takeaways.
HubSpot Marketing HubSpot CRM
This template gives you the ability to aggregate information from 2 HubSpot accounts. Using data calculations, we add together the core marketing funnel values.
HubSpot Marketing HubSpot CRM
This dashboard shows the performance of your campaigns and responsiveness of your sales team.
CallRail
This dashboard shows how your inbound funnel compares to other companies with between $1mil and $10mil of revenue.
HubSpot Marketing
This dashboard shows how your inbound funnel compares to other companies with between $250k and $1mil of revenue.
HubSpot Marketing
This dashboard shows how your inbound funnel compares to other companies with less than $250k of revenue.
HubSpot Marketing
This dashboard shows how your inbound funnel compares to other companies with between $10m and $500m of revenue.
HubSpot Marketing
Intrix CRM Sales dashboard template provides you with insights about new, open and closed deals which will help you to track, and grow your sales pipelines.
Intrix CRM
This dashboard shows how your inbound funnel compares to other companies with between $500m and $1b of revenue.
HubSpot Marketing
This dashboard shows how your inbound funnel compares to other companies with over $1bil of revenue.
HubSpot Marketing
The Intrix CRM dashboard template tracks every stage of your sales funnel and watches for leaks. You can see top of funnel activity for each sales representative.
Intrix CRM

Build custom Sales Funnel dashboards

No design or coding skills necessary.

Learn more about Dashboard Designer

What is a Sales Funnel Dashboard?

A sales funnel dashboard allows you to monitor your prospects as they move through each stage of the buyer's journey. With this dashboard, you’ll be able to see exactly where potential buyers are in the sales funnel at any given time and easily pinpoint where you mostly lose them.

Tracking key sales funnel metrics is helpful for better revenue forecasting, improving your sales and marketing strategy, and more importantly, for generating, qualifying, and converting visitors into paying customers.

What Should Be Included in a Sales Funnel Dashboard?

When building a sales funnel dashboard, it is important to select the right sales metrics and KPIs. This will in turn, allow you to quickly identify what’s working and what isn’t and how to improve your sales strategy and performance over time.

The most important sales funnel metrics you should be tracking are:
  • Pipeline overview
  • New deals amount
  • Closed deals amount
  • Deals leaderboard
  • New contacts

How to Create a Sales Funnel Dashboard

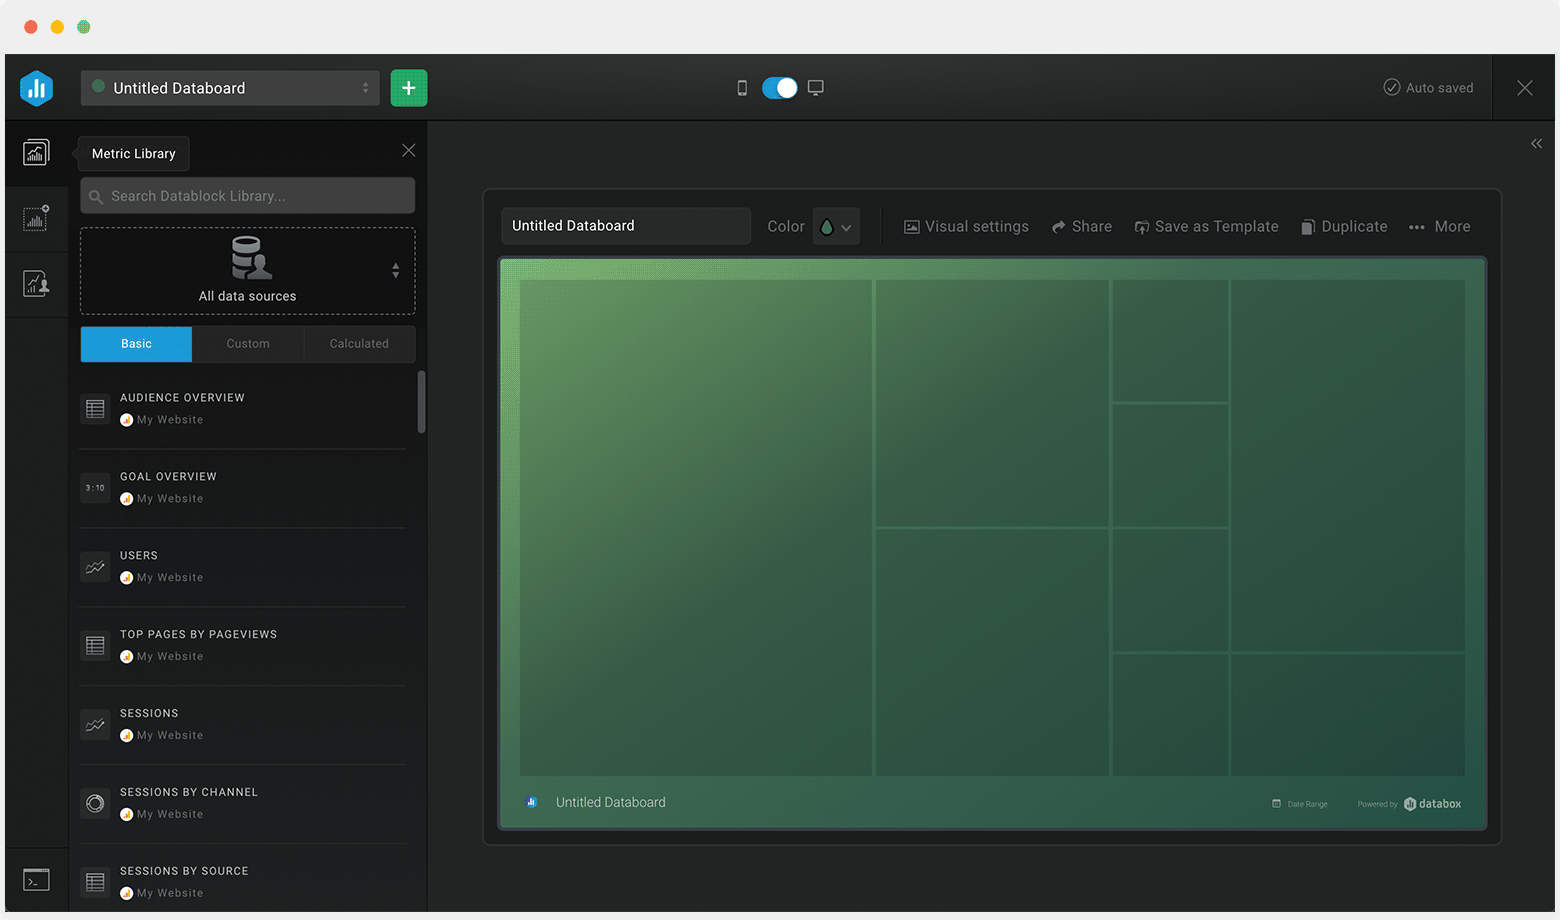
Using Databox’s Dashboard Designer, building a dashboard is as simple as connecting a data source, choosing the metrics you need from our Metrics Library, and watching your visualizations populate in seconds. No coding and design skills are required.

Create a new dashboard using our Designer tool
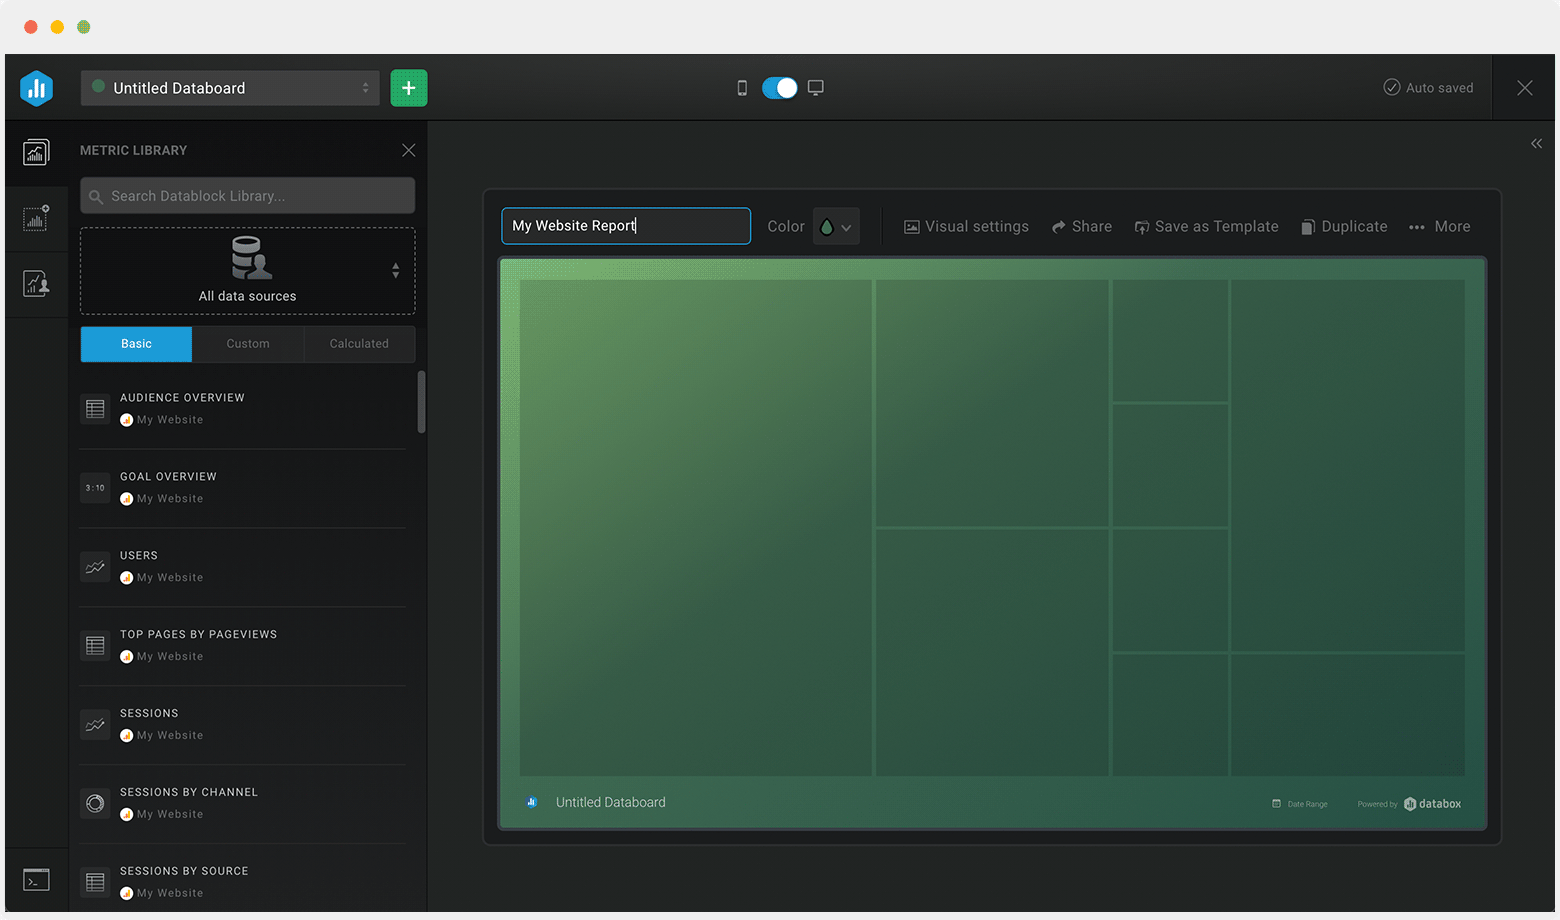
Name your dashboard
Name your dashboard
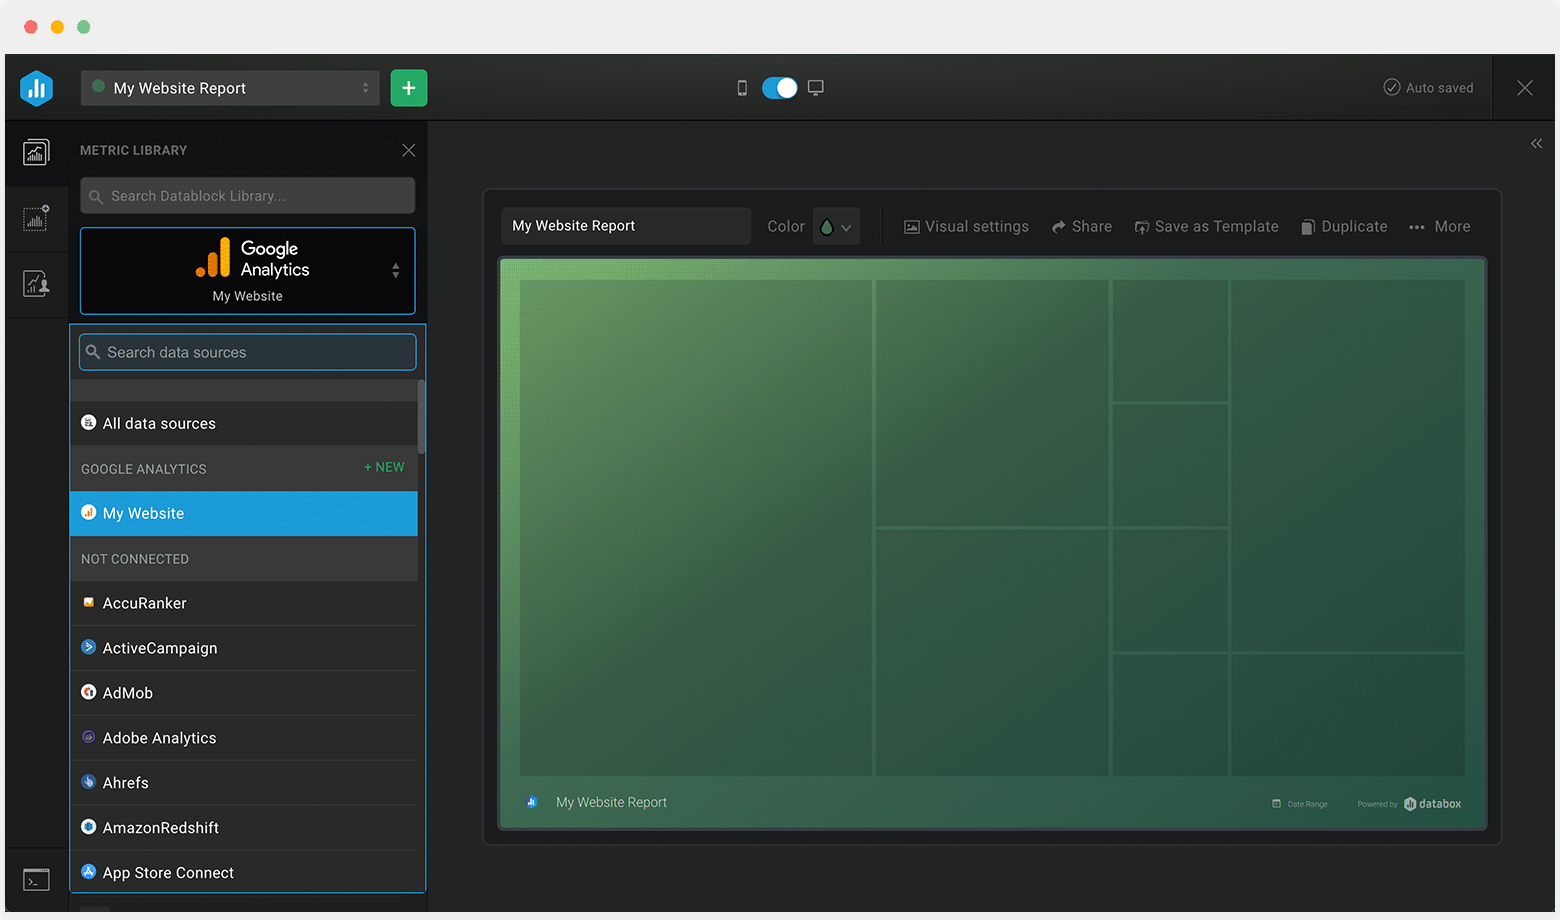
Select a data source
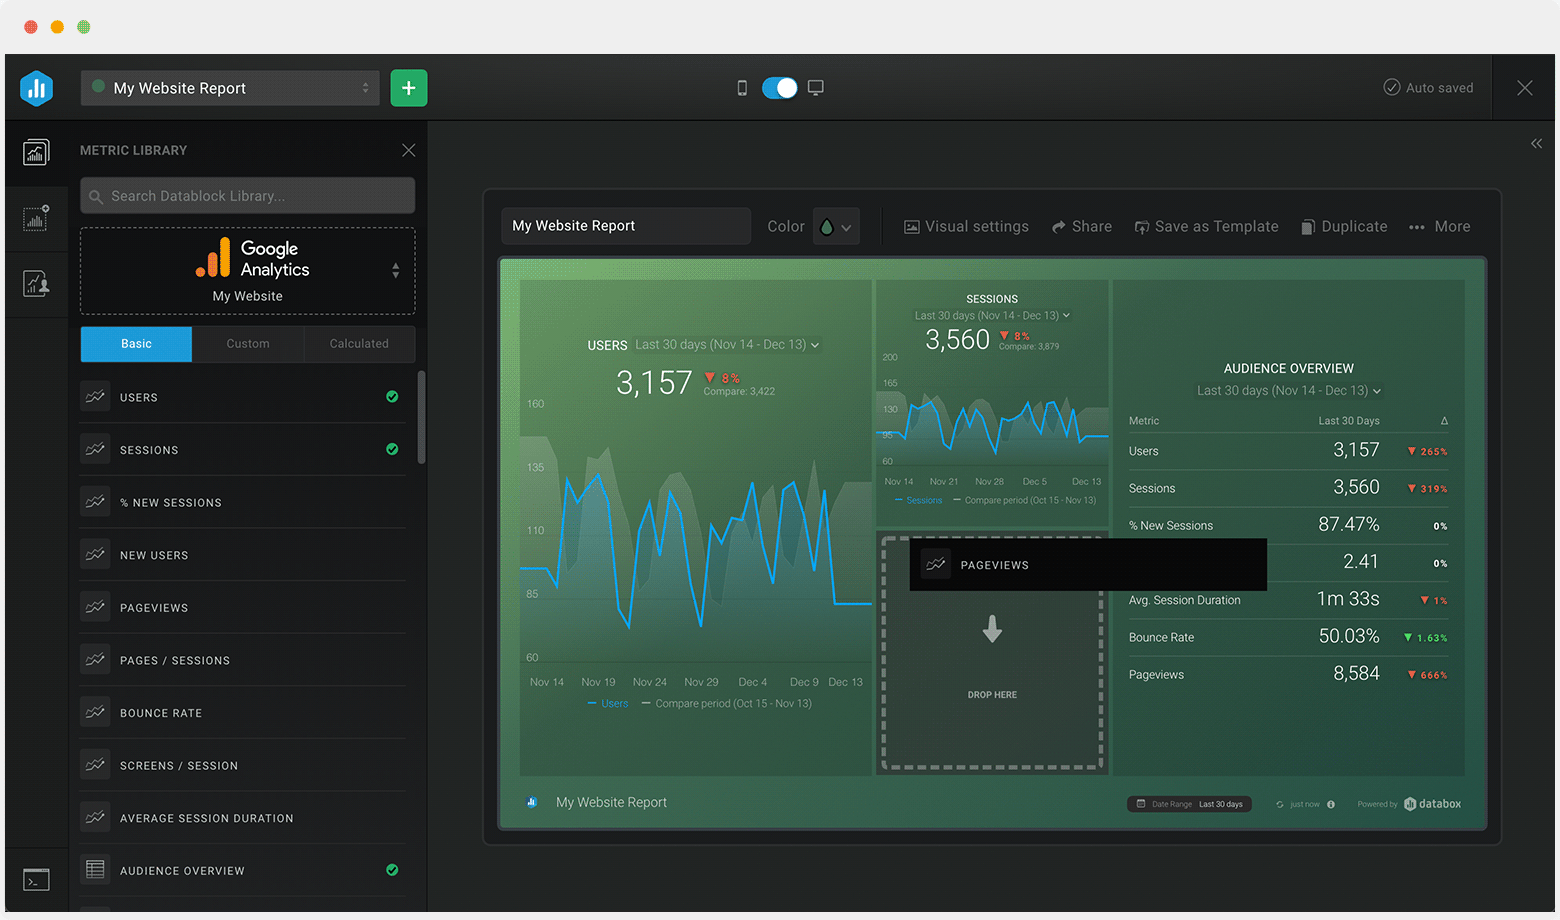
Drag-and-drop pre-built metrics from that source to your dashboard or drag a blank visualization first and select the metric you’d like to associate with it.
Drag-and-drop pre-built metrics from that source to your dashboard
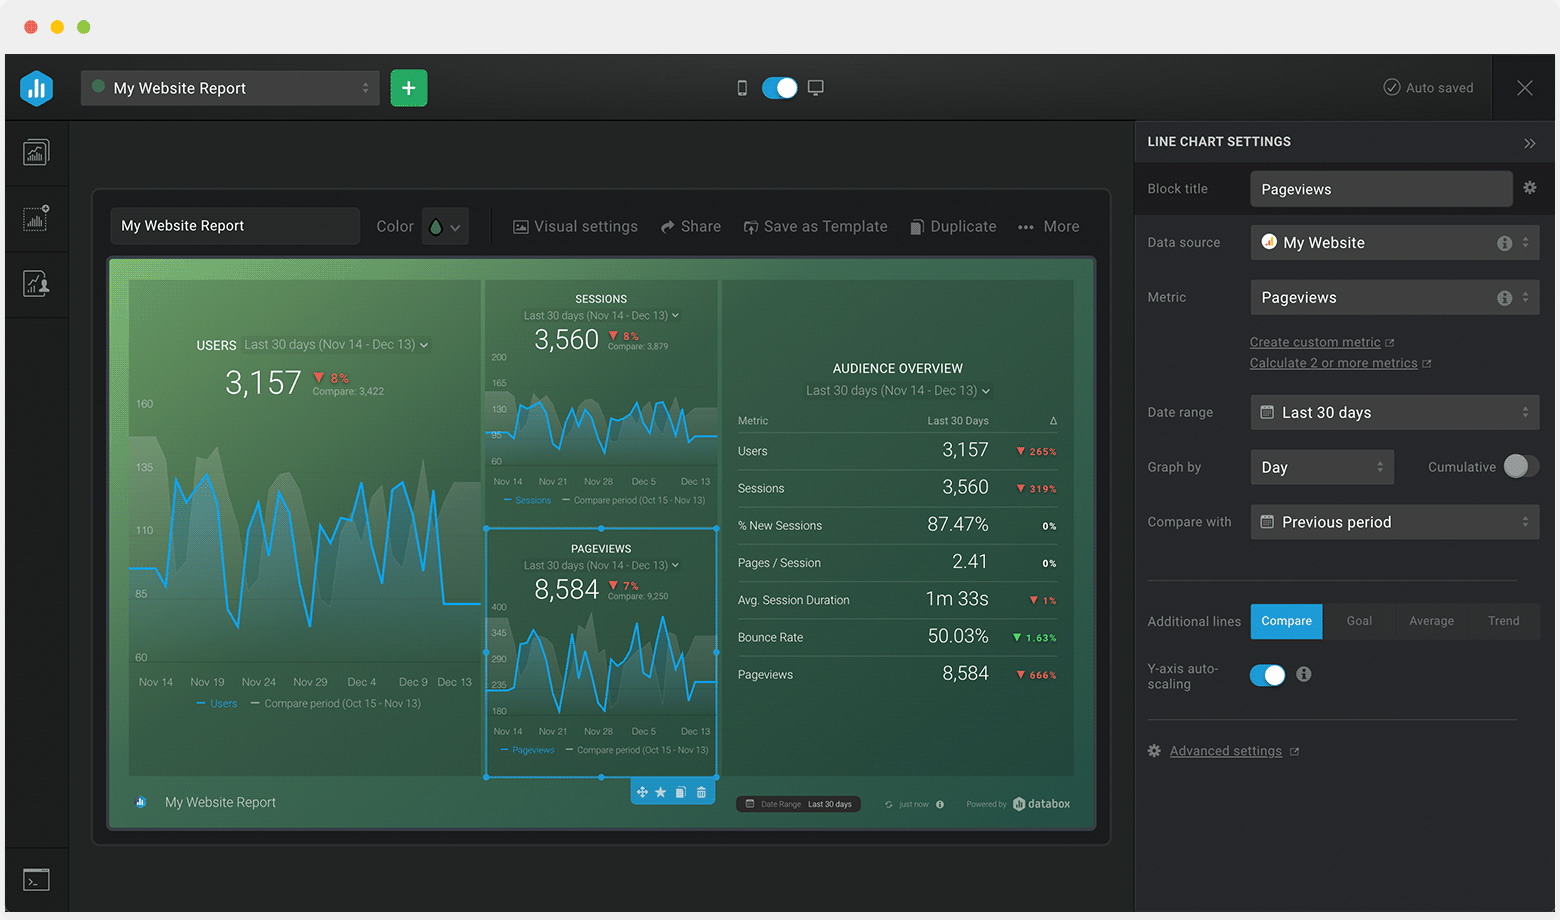
Customize each metric block by date range, comparisons, goals, and more.
Customize each metric block