Uses one-click integrations:
-
 QuickBooks
-
 WooCommerce
If you don't use QuickBooks or WooCommerce, you can pull data from any of our 130+ one-click, native integrations or from spreadsheets, databases and other APIs.
Try this dashboard for free
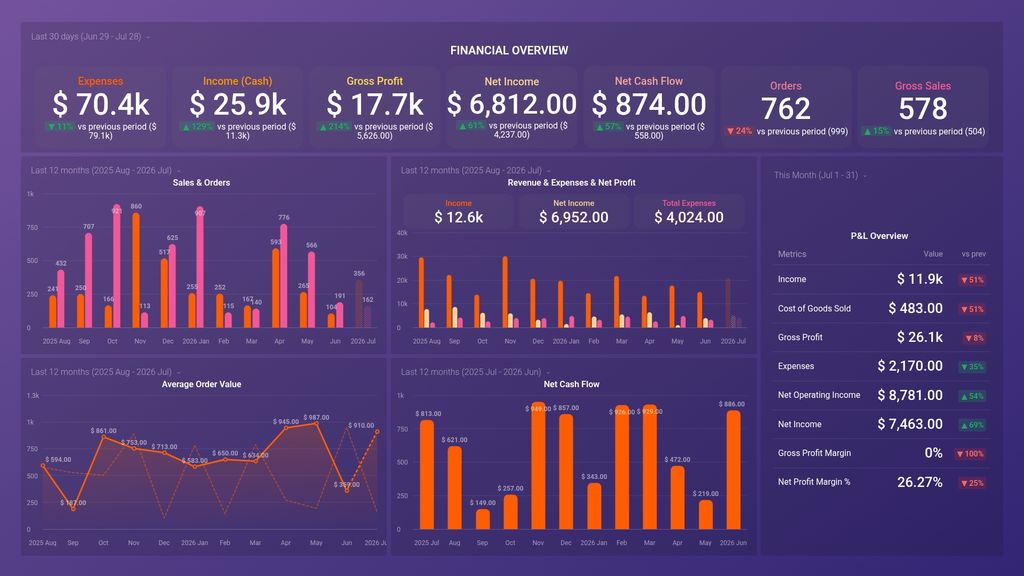
QuickBooks metrics included in this template
-
Cost of Goods Sold (Cash)
Cost of Goods Sold (Cash) is a financial metric that calculates the direct costs incurred in producing goods or services sold during a specific period, reflecting the cash outflows related to inventory, manufacturing, and raw materials.
-
Gross Profit (Cash)
Gross Profit (Cash) is a financial metric that calculates the amount of money a business earns after deducting the cost of goods sold. It represents the profit a company generates from its core business operations before factoring in other expenses.
-
Net Income (Cash)
Net Income (Cash) is the total profit earned by a business after deducting all expenses that have been paid in cash.
-
Net Operating Income (Cash)
Net Operating Income (Cash) is a profitability metric that reflects the income generated by a business's operations after deducting operating expenses and taxes but before deducting interest and other non-operating expenses.
-
Total Expenses (Cash)
Total Expenses (Cash) measures the amount of cash spent by a business during a specific period on all expenses including operating, administrative, and non-operating expenses.
- Gross Profit Margin
- Net Profit Margin %
-
Expenses (Cash)
Expenses (Cash) metric in QuickBooks tracks all the cash spent for business transactions or purchases made, providing an accurate reflection of the true cash flow of the company.
-
Income (Cash)
Income (Cash) is a financial metric that measures the amount of actual cash received by a business during a specific period from sales, services, or other sources. It does not include non-cash revenues or expenses.
-
Total Expenses (Cash)
Total Expenses (Cash) measures the amount of cash spent by a business during a specific period on all expenses including operating, administrative, and non-operating expenses.
WooCommerce metrics included in this template
-
Orders (Product)
Total number of orders placed for all products in WooCommerce Analytics product report, indicating the overall order volume.