Uses one-click integrations:
-
 QuickBooks
If you don't use QuickBooks, you can pull data from any of our 130+ one-click, native integrations or from spreadsheets, databases and other APIs.
Try this dashboard for freeWhat you’ll learn from this Quickbooks Income & Expenses Cash Overview Dashboard template
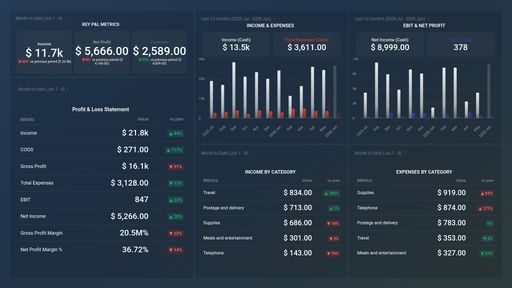
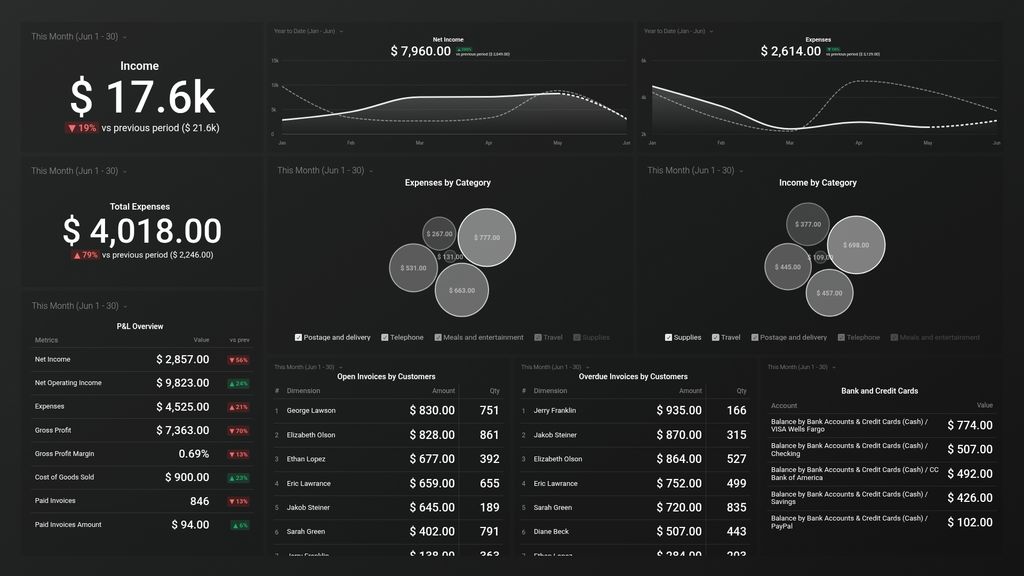
Use this dashboard template to effectively track your company’s financial transactions. Keep track of your debits and credits at a glance and ensure you’re in line to meet and exceed your goals for the quarter. By connecting your Quickbooks account, you’ll learn:
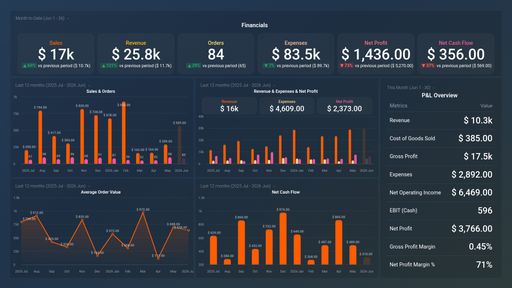
- How much income did my business generate last month? View the amount of money your company generated from selling its products and services along with costs incurred. Also, see how much in total profits your business made after deducting all expenses in a year.
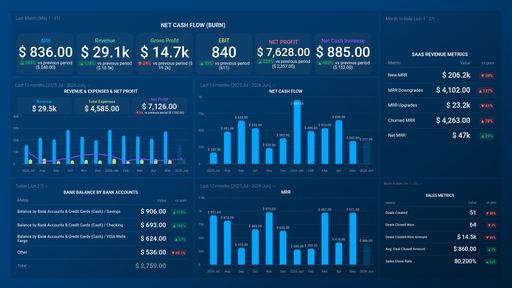
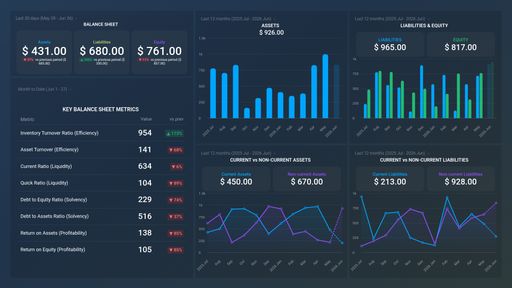
- How do we measure the financial health of our business? Track your business’ sales and expenses within a specified period of time. Monitor key KPIs that matter to the financial health of your business, such as income, gross profit, expenses, net operating income, and so on.
- How do we track credit card purchases? Track all expenses and payments incurred from your bank and credit card accounts. View your bank and credit card accounts and balance anytime, anywhere.
- How do we track open and unpaid invoices? Keep track of all open and overdue invoices and payments to be paid by your clients. See how much exactly your business is expected to receive and figure out ways/incentives to get the payments sorted.
- How do we track our business expenses? See how much it cost to run your business in a month. Track what items and activities make up your business expenses (in percentage).
- How do we report on expenditures to vendors? Track how much you’ve spent on each vendor and how much profit you can expect to make after deducting these expenses. Identify which vendors cost you the most and the least in a given month.
Pull additional data using our robust integration with Quickbooks.
What other campaign metrics can you track and visualize with our integration with Quickbooks? Almost anything:
- Cash flow forecast
- Customer balance
- Income & Sales by customer
- Purchases by vendors
- Inventory valuation
- Budget & forecasting
In Databox there are dozens of Quickbooks metrics already built and ready for you to visualize in a variety of different ways. With the use of Query Builder and Data Calculations, the range of different metrics and metric combinations you can track from Quickbooks widens.
Read more about Quickbooks integration.
Explore more QuickBooks dashboards.
QuickBooks metrics included in this template
-
Paid Invoices Amount
The Paid Invoices Amount metric in QuickBooks represents the total amount of money received from customers for paid invoices. It is a critical measure of the company's cash flow and revenue growth.
-
Paid Invoices
The Paid Invoices metric in QuickBooks tracks the total amount of money received from customers against the invoices that you have marked as paid.