Uses one-click integrations:
-
 QuickBooks
If you don't use QuickBooks, you can pull data from any of our 130+ one-click, native integrations or from spreadsheets, databases and other APIs.
Try this dashboard for free
QuickBooks metrics included in this template
- Equity (cash) - QuickBooks
-
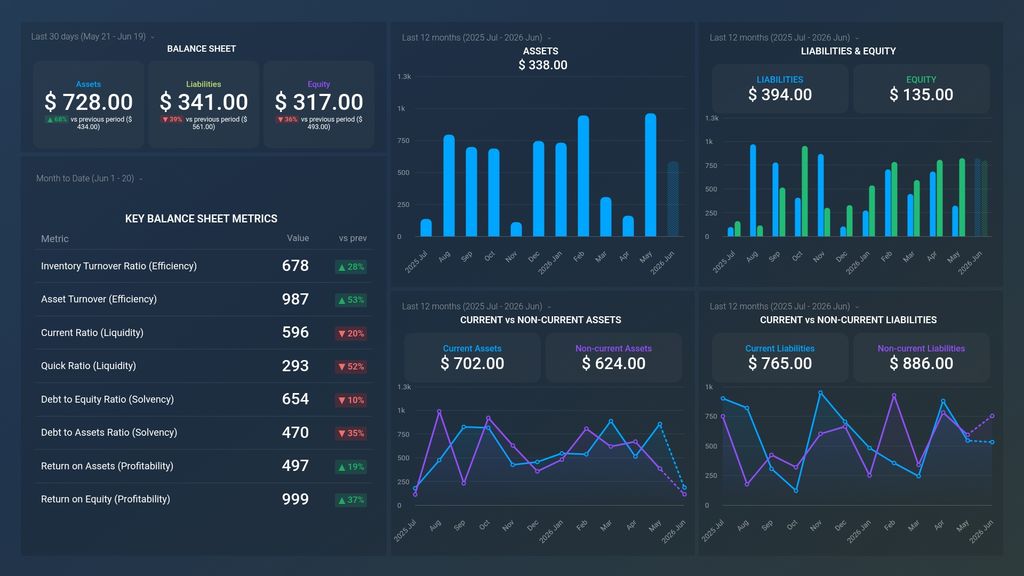
Assets (Cash)
Assets in QuickBooks refer to the resources that a company owns and can use to generate revenue. These include cash, accounts receivable, inventory, and property. Assets are important because they show a company's financial strength and ability to generate income.
-
Current Assets (Cash)
Current Assets refer to the resources that are likely to be turned into cash in only one year or less. Examples include cash, inventory, accounts receivable, and prepaid expenses. It is a critical metric for evaluating a company's liquidity and ability to meet short-term obligations.
-
Current Liabilities (Cash)
Current Liabilities measures the amount of money a company owes for debts that are due within a year, such as loans, accounts payable and taxes.
-
Liabilities (Cash)
Liabilities are financial obligations or debts owed by a business to creditors, suppliers, or other entities. It includes short-term, long-term, and contingent liabilities and is a measure of a company's financial obligations that must be paid in the future.