Uses one-click integrations:
-
 QuickBooks
If you don't use QuickBooks, you can pull data from any of our 130+ one-click, native integrations or from spreadsheets, databases and other APIs.
Try this dashboard for free
QuickBooks metrics included in this template
-
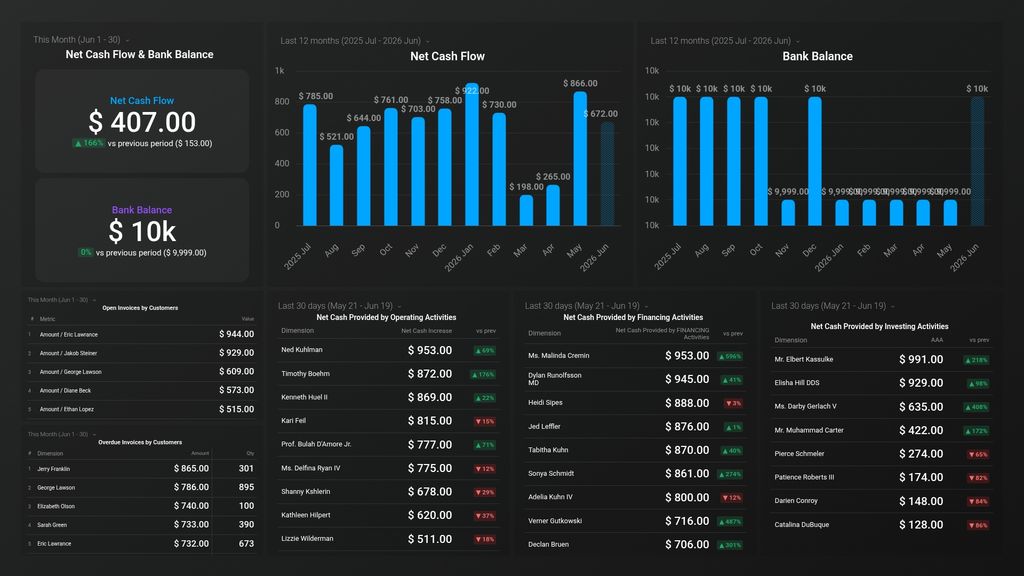
Balance (Cash)
The Balance metric refers to the difference between the total assets and total liabilities of a company at a given point in time. It indicates the financial position of the company and its ability to meet its financial obligations.
-
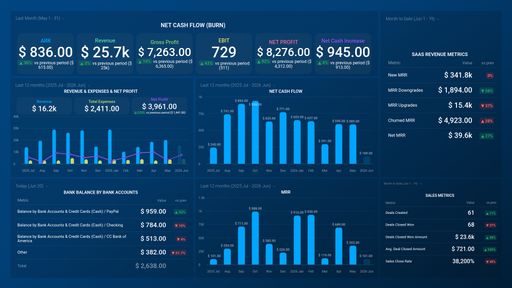
Net Cash Increase
Net Cash Increase is a financial metric that demonstrates the amount by which cash and cash equivalents have increased during a given period. It is calculated by subtracting the cash outflows from the cash inflows.
-
Net Cash Provided by Financing Activities
Net cash provided by Financing activities is the total amount of cash received from or used in financing activities, including debt and equity transactions, during a specified period of time.
-
Net Cash Provided by Investing Activities
Net cash provided by Investing activities measures the cash inflows and outflows related to investment activities during a given period, such as purchases and sales of fixed assets, investments in securities, and acquisitions.
-
Net Cash Provided by Operating Activities
Net cash provided by Operating activities reflects the cash generated or used by an organization's core operations during a specific time period, excluding any financing or investing activities.
-
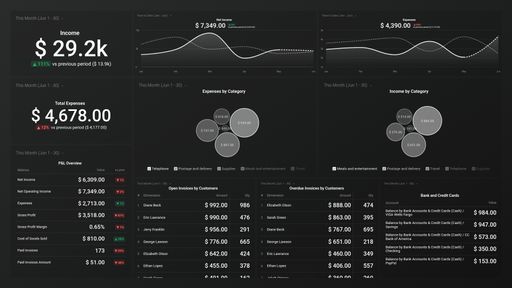
Open Invoices by Customer
The Open invoices by Customer metric shows the total amount of unpaid invoices for each customer, providing insight into accounts receivable and cash flow.
-
Open Invoices Amount by Customer
Open Invoices Amount by Customer indicates the total amount of unpaid customer invoices that are currently open and owed to the business. It is a key metric for monitoring cash flow and collections.
-
Overdue Invoices by Customer
This metric shows a list of customers who have unpaid invoices past their due date, helping you stay on top of overdue payments and improve cash flow management.
-
Overdue Invoices Amount by Customer
This metric shows the total amount of unpaid invoices that are past their due date for each customer in QuickBooks.