Uses one-click integrations:
-
 Shopify
-
 Xero
Xero
If you don't use Shopify or Xero, you can pull data from any of our 130+ one-click, native integrations or from spreadsheets, databases and other APIs.
Try this dashboard for free
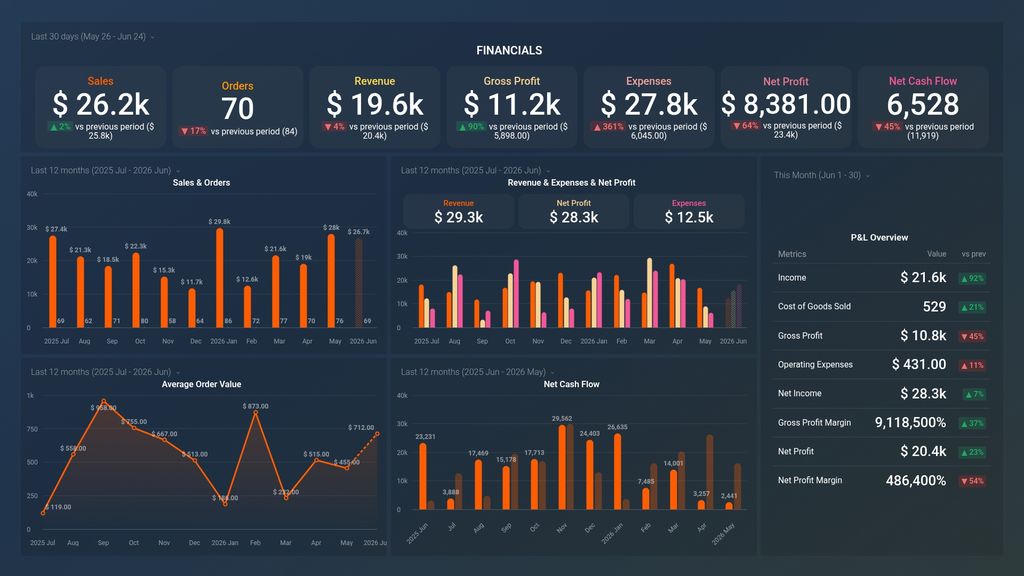
Shopify metrics included in this template
-
Orders
The Orders metric on Shopify represents the total number of purchases completed by customers, providing insights into sales performance, customer behavior and trends.
-
Gross Sales
Equates to product Selling Price x Ordered Quantity during the specified Date Range. Gross Sales does not include Discounts, Returns, Taxes, or Shipping.