Uses one-click integrations:
-
 Shopify
If you don't use Shopify, you can pull data from any of our 130+ one-click, native integrations or from spreadsheets, databases and other APIs.
Try this dashboard for freeWhat you’ll learn from this Shopify Store Overview Dashboard template:
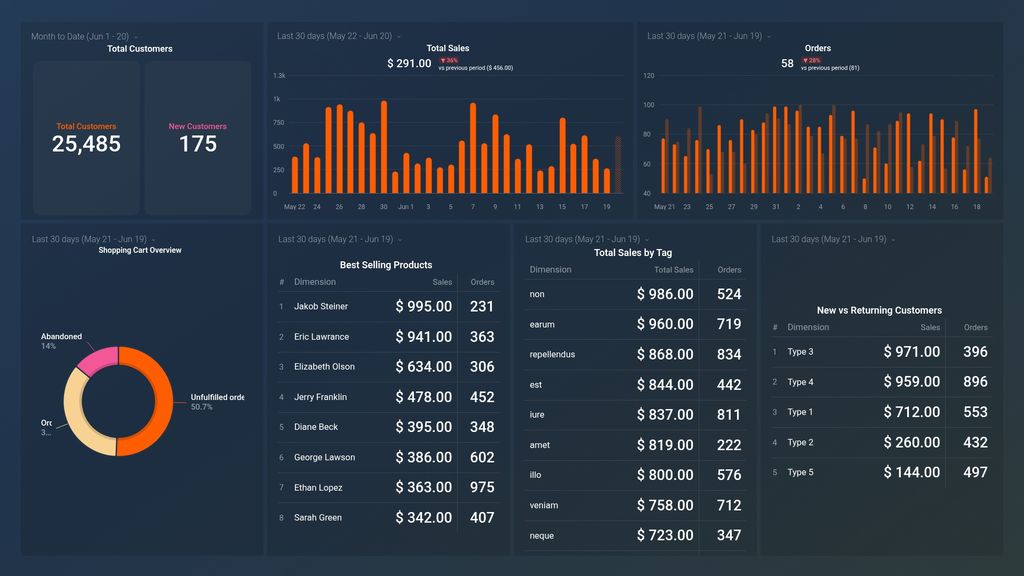
In this Shopify dashboard template, you’ll get a quick overview of the performance of your online store. By connecting your Shopify account, you’ll learn:
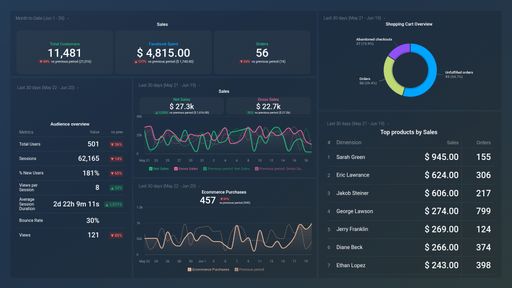
- How many orders does my eCommerce store receive on a daily and/or monthly basis? Track the number of products purchased from your online store on a daily basis. Compare these numbers to previous periods to see if you’re growing sales and overall demand.
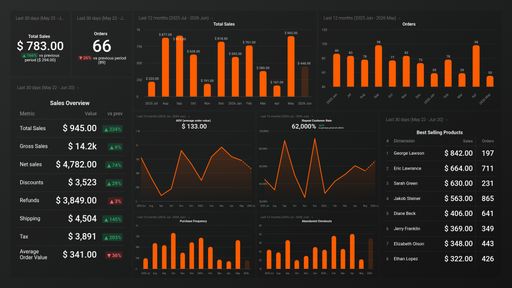
- How much money does my online store make? Track the total sales of all products and services through your online store within a given time period, i.e. last 30 days, month to date, last 7 days, and more.
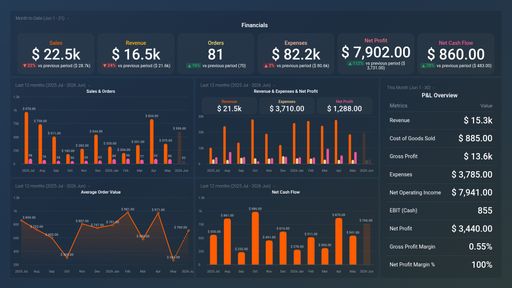
- How much in discounts and refunds does my store issue in total? Track the number of coupons and discounts offered by your online store as well as the total amount in refunds issued to customers.
- How much does my store make after all refunds and discounts have been deducted? How profitable is your online store? Track total sales from your online store after all costs have been subtracted such as returns, damaged, or missing goods, discounts, taxes, etc.
- Is my shopping cart set up properly? Monitor trends in the checkout process that result in abandoned carts, unfulfilled orders, and completed orders. Assess if your shopping cart is built to support the purchasing decisions of your visitors and repeat customers.
- How many new and repeat customers does my online store have? How effective is your store in generating new customers? How about repeat customers? Monitor performance in these areas and make adjustments where necessary.
- What are my best-selling products? See which products are most popular among your store’s visitors and previous shoppers in terms of volume and revenue.
Pull additional data using our deep integration with Shopify.
Dig deeper into your store’s data using our robust integration with Shopify.
What else can you track and visualize with our deep integration with Shopify? When it comes to measuring your online store’s performance, just about everything:
-
-
- Gross and Net sales
- Average Order Value (AOV)
- Sales by product
- Abandoned cart rate
- New vs. returning customers
- Low inventory products
- Taxes, and more
-
There are tons of useful metrics and metric combinations you can track using Shopify. And in Databox, you can quickly visualize dozens of Shopify metrics in a variety of ways.
Read more about Databox’s Shopify integration.
Shopify metrics included in this template
-
Orders by Tag
Orders by Tag is a metric in Shopify that allows you to track the number and value of orders based on assigned tags. This gives you insight into customer behavior and trends, allowing you to make data-driven decisions on product offerings and marketing strategies.
-
Orders by New vs Returning Customers
The Orders by New vs returning customers metric compares the number of orders made by new customers to those made by returning customers. It helps track customer loyalty, acquisition efforts, and sales growth potential.
-
Total Sales by Tag
Equates to Gross Sales - Discounts - Returns + Taxes + Shipping Charges during specified Date Range split up by Tag.
-
Total sales by New vs returning customers
Equates to Gross Sales - Discounts - Returns + Taxes + Shipping Charges during the specified Date Range split up by New vs Returning Customers.