


Table of contents
When it comes to eCommerce and eCommerce KPIs, the difference between success and failure can often come down to the numbers. But not just any numbers — the right numbers. The ones that give you a crystal-clear picture of your performance, guide your strategy, and help you make data-driven decisions.
These are your Key Performance Indicators, and they’re more than just metrics and numbers on a spreadsheet; they’re the lifeblood of your online business.
But with so many KPIs to choose from, how do you know which ones are truly vital for your eCommerce success?
That’s where we come in: with the right data and expert-backed tips.
We’ve surveyed 58 eCommerce professionals to bring you the ultimate list of eCommerce KPIs — the ones that the pros track, the ones that really move the needle.
Let’s dig in!
- What are KPIs for eCommerce?
- How to Choose the Best eCommerce KPIs for Your Business
- Most Important eCommerce KPIs for Tracking Sales Performance
- Most Important eCommerce KPIs for Tracking Marketing Performance
- Most Important eCommerce KPIs for Tracking Customer Service Performance
- The Best Tools for Tracking eCommerce Analytics
- Empower Your eCommerce Success with Databox

What are KPIs for eCommerce?
Ecommerce KPIs are the critical indicators that reveal the performance of your online business against your set goals and objectives. They provide you with insights that drive your strategic decisions.
By tracking the right eCommerce KPIs, you empower yourself to make informed decisions that can significantly enhance conversions, revenue, marketing effectiveness, customer satisfaction, and overall operational efficiency.
Editor’s note: Having a hard time tracking your eCommerce KPIs? With Databox, you can automate performance alerts and make adjustments when they matter most.
How to Choose the Best eCommerce KPIs for Your Business
With data privacy regulations like GDPR and CCPA limiting third-party data collection, eCommerce businesses should prioritize KPIs derived from first-party data. Metrics such as customer lifetime value (CLV), repeat purchase rates, and email engagement are now even more critical. Investing in tools that integrate directly with your CRM or use anonymous customer profiling can help maintain robust analytics without breaching privacy standards There are tons of KPIs available to monitor, but they’re not all important to the success of your eCommerce business. So when it comes to choosing eCommerce KPIs, your focus should be on the ones that provide the most valuable insights.
Here’s how to choose the best eCommerce KPIs for your business:
- Align Them with Your Business Goals: Your KPIs should directly impact your bottom line and support your business strategy. They should reflect your overall performance and help you track progress toward your specific goals.
- Ensure Measurability: The best KPIs are quantifiable and provide unique insights into your business’s progress and results. They should be easily measurable and understandable by your team.
- Consider Your Growth Stage: The importance of certain KPIs can change depending on the current growth phase of your eCommerce business. Whether you’re in the start-up, growth, maturity, or renewal/decline phase, choose KPIs that are most relevant to your stage.
- Reflect Your Reality: KPIs can vary significantly from one eCommerce business to another. Don’t just follow industry trends or mimic another business’s metrics. Choose KPIs that are most relevant to your specific business context.
- Keep It Short and Effective: Remember, less is more. There’s no point in tracking a multitude of irrelevant KPIs that will only overwhelm you. The best KPIs for your business are those that provide meaningful and actionable insights.
Tracking Sustainability KPIs to Align with Consumer Demand
By carefully selecting your eCommerce KPIs, you can ensure that you’re focusing on the metrics that truly drive your business forward.
As consumer demand for sustainable practices grows, eCommerce businesses should start tracking sustainability KPIs, such as:
- Carbon footprint per order: Measure the environmental impact of deliveries and packaging.
- Percentage of sustainable products sold: Track how eco-friendly product lines perform compared to other categories.
Return rate of recyclable packaging: If applicable, measure how many customers reuse or return sustainable packaging. Incorporating these metrics can attract environmentally conscious consumers and set your brand apart in a competitive market.
Most Important ECommerce KPIs for Tracking Sales Performance
Sales performance KPIs are pivotal indicators of your business’s financial health and the effectiveness of your sales strategies. They help set sales manager goals and offer valuable insights into revenue generation, customer buying behavior, and overall sales efficiency. Mobile commerce (m-commerce) continues to dominate, with mobile shopping accounting for over 70% of global eCommerce traffic. Alongside traditional KPIs, track mobile-specific metrics like mobile cart abandonment rates, mobile conversion rates, and load times for mobile users. Optimizing your mobile experience can lead to significant gains in customer retention and revenue
- Annual Repurchase Rate
- Net Profit
- Sales
- Average Order Size
- Gross Profit
- Average Order Value (AOV)
- Conversion Rate
- Cart Abandonment Rate
- Checkout Abandonment Rate
- Add-to-Cart Rate
- Orders Per Active Customers
- Gross Merchandise Volume (GMV)
- New Customer Orders vs. Returning Orders
- Cost Of Goods Sold (COGS)
- Product Affinity
- Inventory Levels
- Customer Lifetime Value (CLV)
- Revenue Per Visitor (RPV)
- Customer Acquisition Cost (CAC)
- Cost Per Acquisition (CPA)
- Average Profit Per Customer
Annual Repurchase Rate
The annual repurchase rate is a key indicator of customer loyalty. As Lars Lofgren of Quick Sprout puts it, “If the bulk of your customers come back every year, you can focus on product quality and loyalty. If you have to rebuild your customer file every year, you have an acquisition-driven business.”

Net Profit
Dennis Moons of Store Growers emphasizes the importance of net profit, stating, “If you’re turning a profit, it means your foundation is good. It gives you breathing room and allows you to invest in sustainable growth.”

Sales
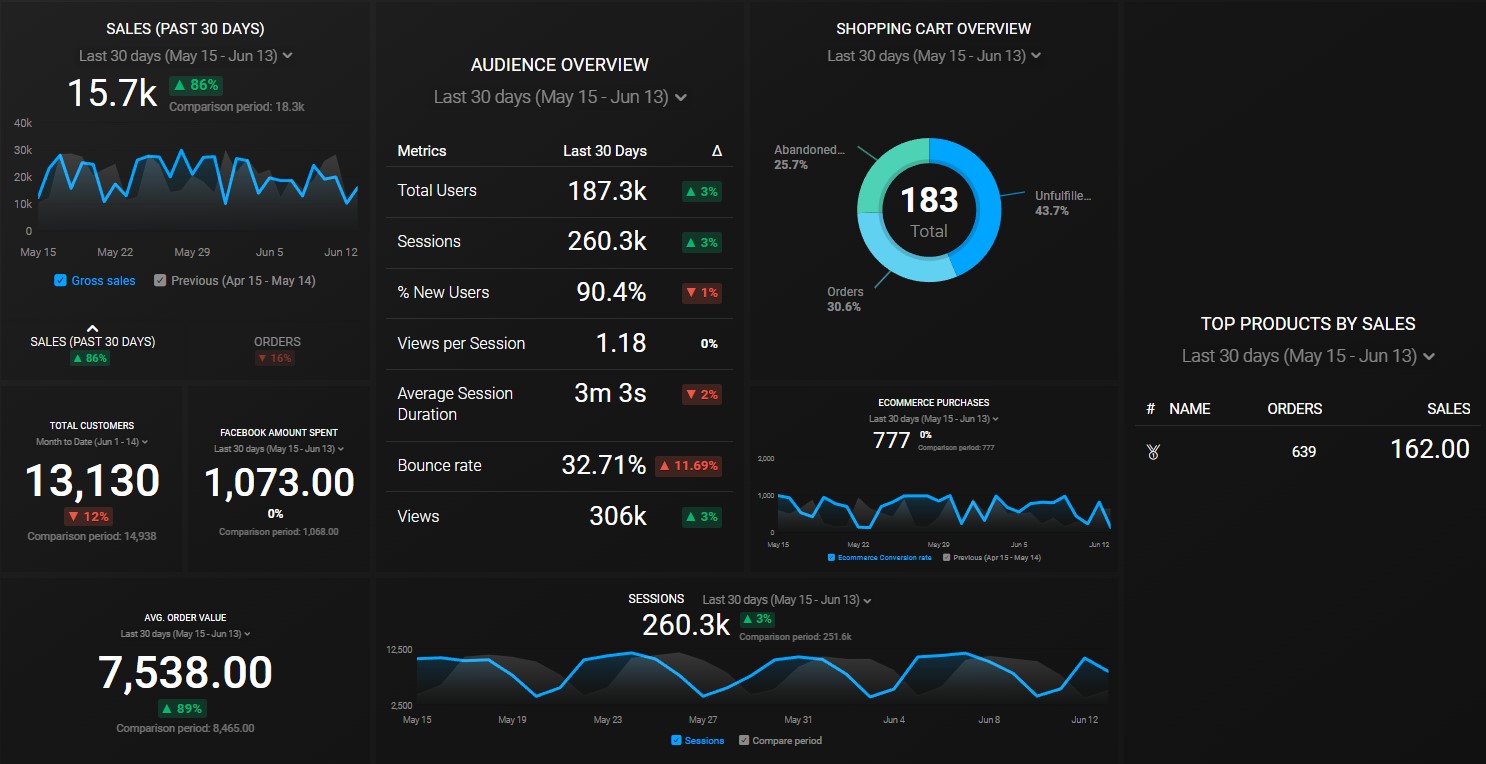
Sales are the lifeblood of any eCommerce business. Your total sales are the total amount of goods or services sold over a specific period.
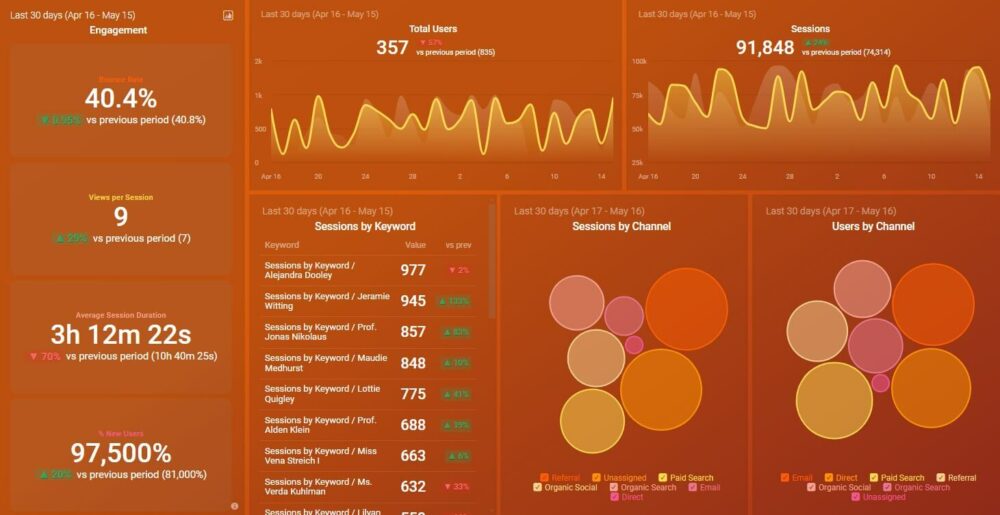
You can use this Online Sales dashboard if you want to keep an eye out for sales but also track other eCommerce metrics like total users, sessions, bounce rate, and views.
Average Order Size
The average order size is a measure of how many items customers typically purchase in a single transaction.

Gross Profit
Gross profit is a measure of profitability before operating expenses and taxes. You can calculate it by subtracting the total expenses from the total sales.

Average Order Value (AOV)
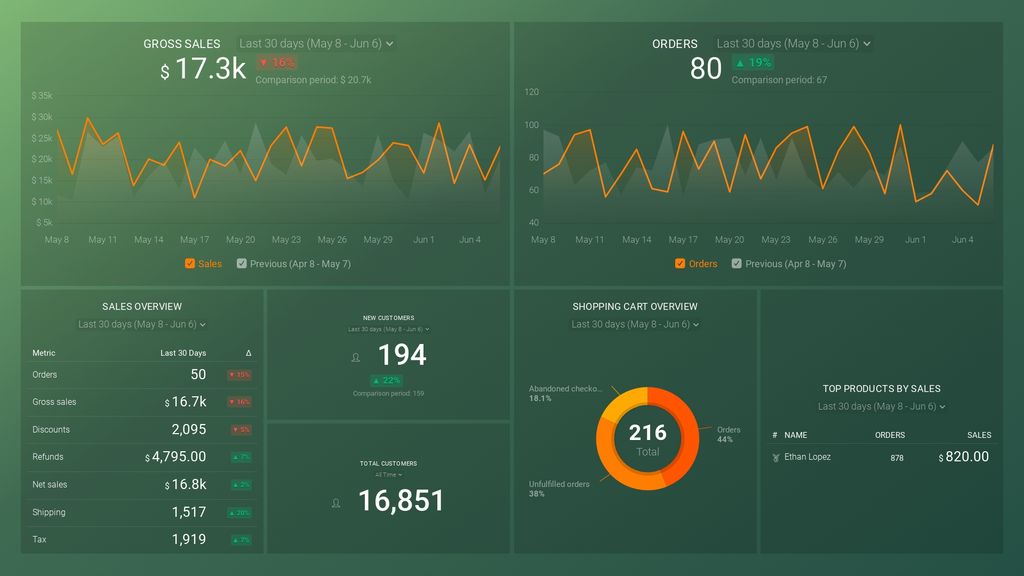
Average order value is the average amount of money a customer spends per transaction. Andrea Rijna’ of Sana Commerce emphasizes the importance of monitoring your AOV: “It’s a key KPI because it helps measure how well you capitalize on cross-selling and upselling opportunities.”
“Increasing your average order value is one of the most efficient ways to increase your eCommerce revenue,” Rijna says.With the eCommerce Overview dashboard, you can stay on top of your average order value as well as other metrics that are relevant for your business like transactions, total revenue, purchases, and RPU.

Conversion Rate
Our respondents identified conversion rate as by far the most important eCommerce KPI that needs to be tracked. It’s the rate at which users on your eCommerce site are buying your products or services.

Jaykishan Panchal of E2M Solutions highlights the importance of conversion rate, stating, “Your conversion rate is indicative of how successful all of your business strategies are in getting people to engage with your ecommerce website. Ultimately, it impacts just about every other KPI involved in ecommerce.”
At Superior Honda, Julien Malet says that “comparing month-to-month and year-over-year conversion rates allows us to pinpoint the source of our increased revenue. And setting quarterly KPIs for our goal conversion rate helps us stay on track to achieve our desired percent increase in annual revenue.”
What’s a Good Conversion Rate for an eCommerce Business?
As you start tracking your conversion rate, you may find yourself asking if your conversion rate is good or not. To provide you with some benchmarks, we asked our respondents what they think is a good conversion rate for an eCommerce business.

According to our benchmark data, the median conversion rate based on 687 contributors is 1.15%, with the top quartile showing values of 2.32% and above.
Benchmark Your Performance Against Hundreds of Companies Just Like Yours
Viewing benchmark data can be enlightening, but seeing where your company’s efforts rank against those benchmarks can be game-changing.
Browse Databox’s open Benchmark Groups and join ones relevant to your business to get free and instant performance benchmarks.
A couple of respondents also offered suggestions for how to improve your conversion rate.
Alistair Dodds of Ever Increasing Circles recommends “improving your conversion rate through onsite optimization split-testing, threshold-free shipping pricing, product bundles, and FOMO.
With the same amount of traffic, you can effectively double or triple your revenue through effective conversion optimization testing.”
Kevin Williams of SurgeStream offers a few more recommendations:
- “If your website structure is confusing, reorganizing it so that users can find your products more easily can have a big impact on conversions.”
- “Website speed: the slower your website, the lower your overall conversion rate.”
- “Adding trust factors such as third-party site seals, logos, and customer reviews can also increase your conversion rate.”
Cart Abandonment Rate
The cart abandonment rate is a measure of the number of potential customers who start the checkout process but do not complete their purchase.
ROCKETSHP’s Mark Hayes suggests looking for things like a complicated checkout process or too-high shipping costs when trying to fix a high abandonment rate. “Then I work with clients on fixing those. In one client’s case, fixing an overly complicated checkout process lead to $100,000 in additional revenue,” Hayes says.
Eric Melillo of COFORGE echoes this approach. “Think of cart abandonment as a source of resistance. If there’s too much product info, the page may seem heavy. If there are too few features or weak photography, the product feels less valuable. If pages load slowly or there are too many checkout steps, users get impatient. Inflexible or problematic checkout processes cause the user to get frustrated and bail.”
“Monitoring each friction point can help ease the checkout process. Typically, they are easy fixes that create quick wins, produce less abandonment, and generate more completed sales,” Melillo says.
Here’s a dashboard template you can use to monitor cart abandonment rate and analyze eCommerce metrics and KPIs like monthly sales, average order value, new and returning customer sales, and more.
Checkout Abandonment Rate
Checkout abandonment is when a shopper goes through their journey by adding one or more items to their cart, entering their personal and credit card information in the checkout step, and then deciding not to complete the purchase for whatever reason.

Add-to-Cart Rate
While add-to-cart rate isn’t a popular metric, Dennis Edward of Core dna recommends tracking it as it “tells you what percentage of your visitors actually added a product to their carts.”
“This is important because it tells you if you’re attracting the right audience if your visitors come to your site with a specific purpose in mind (or if they’re ‘just looking around’) and if your products and/or prices meet your target consumers’ expectations.”

Orders Per Active Customer
This KPI measures the average number of orders placed by each active customer. Generally, the more orders per active customer you have, the better your customer retention.

Gross Merchandise Volume (GMV)
GMV is the total value of merchandise sold over a certain period. A high GMV indicates a high level of sales activity.
Samuel Gibson of Enjovia calls it the most important eCommerce KPI: “Many other metrics are critical to improving conversions and sales, but GMV allows us to see the overall success of our eCommerce platform in one figure. Ultimately, if the overall volume is increasing, we are growing, and customers are using the system.”

New Customer Orders vs. Returning Orders
This KPI compares the number of orders from new customers to those from returning customers. A balance between new and returning customer orders is ideal for sustainable growth.

Cost Of Goods Sold (COGS)
The cost of goods sold is the total cost of all the goods a company sells during a certain period. COGS is an important consideration in calculating profitability.

Product Affinity
Product affinity measures the relationship between different products. Understanding this metric can help you make more effective product recommendations.
Inventory Levels
Keeping track of inventory levels is crucial for avoiding stockouts and overstock situations. Accurate inventory tracking can help you maintain the right balance and avoid lost sales.

PRO TIP: Get Useful, Actionable Data on Your Ecommerce Store’s Performance
To improve the performance of your online store, it’s vital to have access to useful and actionable data. But, with so many metrics available to track, it may be hard to determine which ones will actually help you move the needle.
That’s why we have created a concise dashboard template that only tracks the most important metrics for analyzing the core elements of your ecommerce businesses, such as:
- Transactions and orders. How many transactions does your online store process in a day, a week, or a month? How many orders, and how many were placed on the same day of the previous month?
- Sales volume and trends. See how much money has been generated from sales in the current month. Analyze daily trends to compare with your sales goals and take action to reach them.
- Website traffic trends. Track the number of new and returning visitors to your website and the number of individual sessions initiated by these users.
- Conversion to customers. See what percentage of your website visitors convert to customers.
- Revenue per customer. See how much revenue you get from each unique visitor that interacts with your store during a given time period.
- Amount per transaction. Track the average dollar amount each customer spends on a sale.
- Best-selling products. See your most popular products in terms of volume and revenue in a given period.
And more…
Now you can benefit from the experience of our Google Analytics 4 experts, who have put together a plug-and-play Databox template showing the most important KPIs for monitoring your online store’s performance. It’s simple to implement and start using as a standalone dashboard or in ecommerce reports!

You can easily set it up in just a few clicks – no coding required.
To set up the dashboard, follow these 3 simple steps:
Step 1: Get the template
Step 2: Connect your Google Analytics 4 account with Databox.
Step 3: Watch your dashboard populate in seconds.
Customer Lifetime Value (CLV)
CLV is a prediction of the net profit attributed to the entire future relationship with a customer.
According to Kurt Estler of The Unofficial Shopify Podcast: “No metric captures the overall health of an eCommerce business quite like customer lifetime value. Conversion rate, average order value, and return customer rate are all reflected in CLTV.”
“Knowing how much revenue a customer generates over his/her lifetime can help you invest in the right channels sooner, even if your competitors shy away because the direct revenue from that channel appears to be unprofitable,” adds Troy Fawkes of Delta Growth.
And in addition to tracking your CLTV, Andrew McLoughlin of Colibri Digital Marketing also recommends tracking it “relative to the intake point to make sure that the business is growing steadily. Lifetime value should increase so that a new customer this year has a higher value than a new customer a year ago.”
Revenue Per Visitor (RPV)
RPV is a measure of the amount of money generated each time a customer visits your site. A high RPV indicates a high level of customer engagement.

Customer Acquisition Cost (CAC)
CAC is the cost associated with convincing a potential customer to buy a product or service. A low CAC is ideal for profitability.
“Knowing and understanding CAC is critical. An eCommerce business selling high-ticket items for $1,000+ is okay with paying $100 to buy a customer, but if you’re selling items with a $50 price tag, you can’t afford that cost. For this reason, it’s essential to keep your CAC in check at all times,” says Djordje Milicevic of StableWP.
“Think of it like this: you could make more sales by throwing more money into marketing. But if your CAC goes up, making more sales could actually bring down your profits. You’re bleeding money on acquiring new customers. If you don’t track your CAC, your business may soon collapse, and you won’t even know why.”
“Understanding your CAC helps you plan how many customers you want to acquire in a certain period and then allocate your marketing budget appropriately to get the highest performance and profitability,” Milicevic concludes.

Cost Per Acquisition (CPA)
CPA is similar to CAC but includes all costs associated with acquiring a new customer, not just marketing costs. A low CPA means you’re spending less to acquire each customer, which is good for your bottom line.
According to Kyle Parsons of Ascenditt, “CPA is the metric that calibrates for all other KPIs to tell us if they are performing at sustainable levels. If we know our CPA, then we can safely project our ROI, which is vital to scaling up.”
“For example, if your ecommerce store converts at 7%—but your CPA leaves no room for profit on the sale and lifetime value of the customer—then 7% is actually not a good sustainable number. CPA allows us to look at every other KPI with an honest vision and determine if we’re on the right track.”

Average Profit Per Customer
This KPI measures the average profit generated from each customer. The higher your average profit per customer, the more profitable your business.
Stan Tan of Selby‘s sums it up as: “The more profit you can get out of a customer, the more you can afford to spend on acquiring that customer.”
“For example, if each customer on average is worth $1,000 to you, you can afford to spend anything below $1,000 to be profitable. Whereas if a competitor’s average profit per customer is only $200, they can’t spend anything above $200—but you can because each customer is worth more.”
Most Important eCommerce KPIs for Tracking Marketing Performance
How impactful are your marketing efforts? Marketing performance KPIs provide the answer. They shed light on campaign effectiveness, customer engagement, and the return on your marketing investment.
- Website Traffic
- New Visitors vs Returning Visitors
- Revenue Per Site Visitor
- Time On Site
- Bounce Rate
- Page Views Per Visit
- Average Session Duration
- Traffic Sources
- Mobile Site Traffic
- Return on Investment (ROI)
- Return on Ad Spend (ROAS)
- Influencer ROI
- Newsletter Subscribers
- Email Open Rate
- Email Click-Through Rate (CTR)
- Unsubscribes
- Social Media Followers
- Social Media Engagement Rate
- Cost Per Click (CPC)
- Organic Search Rankings
- Clicks
Website Traffic
Website traffic is a fundamental KPI for any eCommerce business. It’s the number of people visiting your website and a clear indicator of your online visibility and the effectiveness of your marketing efforts.
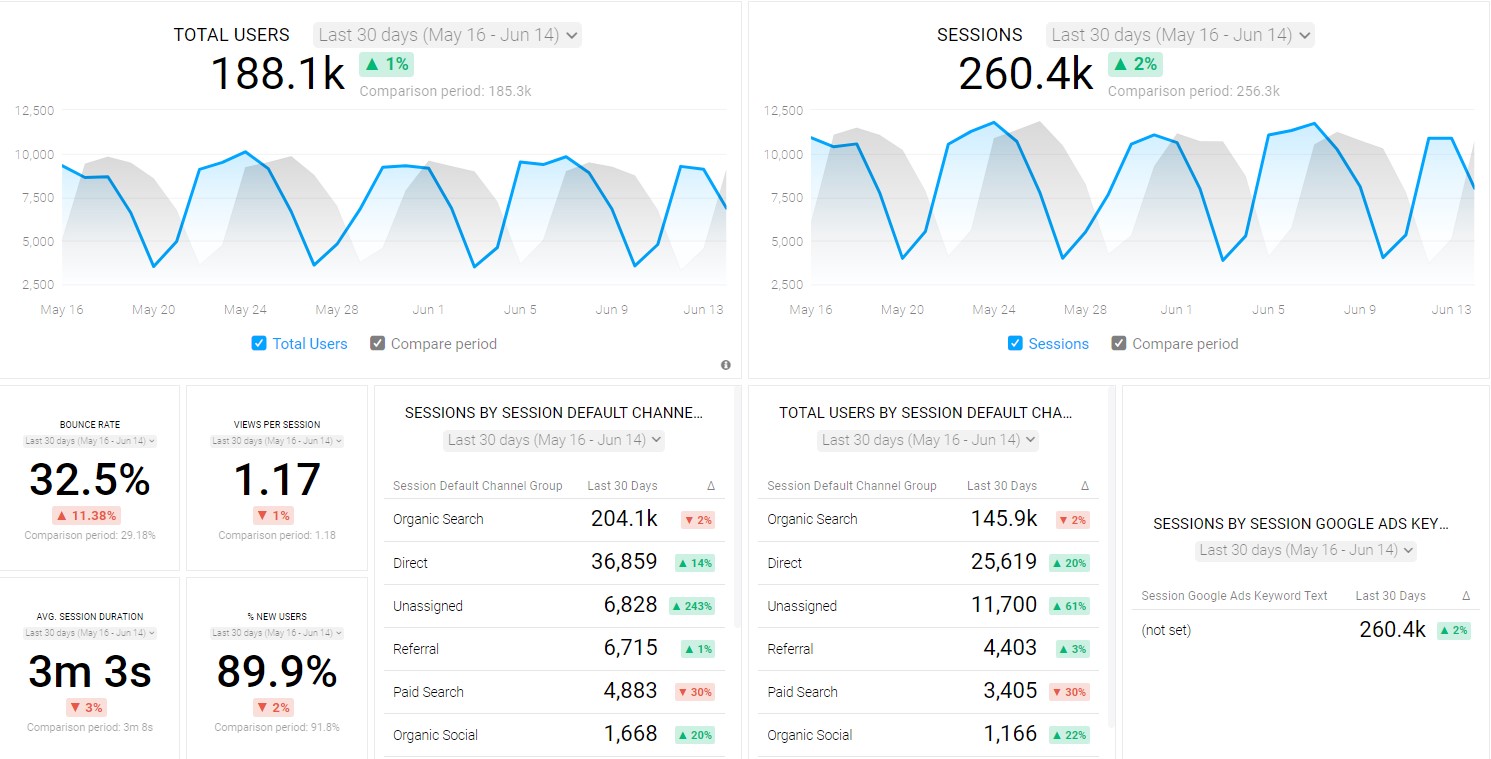
Monitoring your website traffic can help you understand your audience better, improve your SEO strategies, and optimize your website for a better user experience.
Website Traffic Dashboard template allows you to keep track of a variety of metrics in addition to traffic. This includes total users, bounce rate, vies, and many more.
New Visitors vs Returning Visitors
The balance between new and returning visitors can provide valuable insights into your customer retention strategies and the effectiveness of your marketing campaigns in attracting new customers. A healthy mix of both is ideal for a thriving eCommerce business.

Revenue Per Site Visitor
This metric is fairly self-explanatory, and Chloe Thomas of eCommerce MasterPlan recommends tracking it as it: “removes all of the bumps and enables you to quickly track performance across time.”

Time On Site
Jeff Neal of The Critter Depot emphasizes the importance of tracking time on-site, especially for businesses that focus on providing informative content to their customers. Neal says, “Ours is creating in-depth and informative care guides for reptile owners, so the metric we’re obsessively tracking is time on site for our care-guide pages.”
“We believe if users are spending more time on the site and learning about reptiles as pets, then they are more likely to purchase live insects from our store.”

Bounce Rate
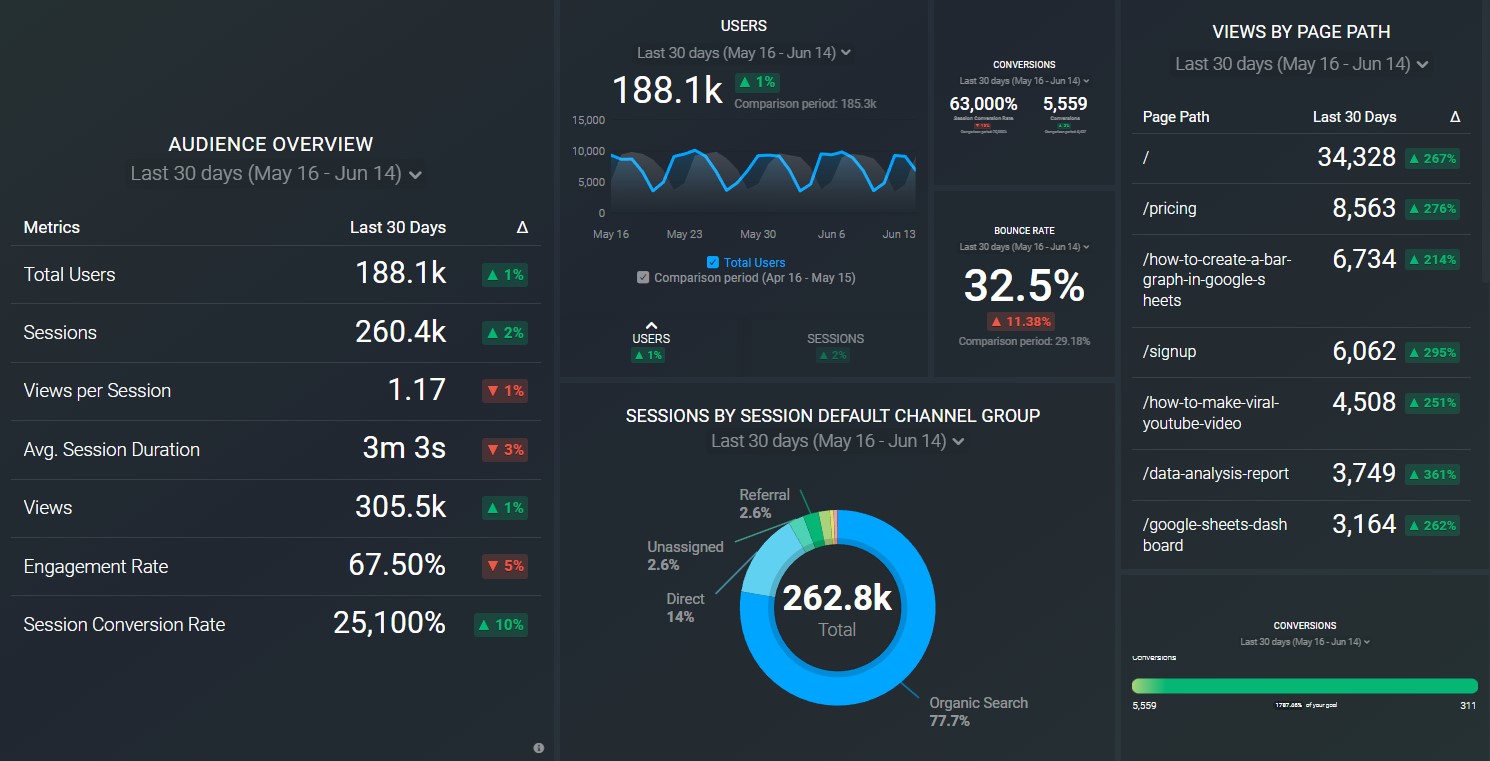
“Bounce rate is an important e-commerce KPI,” says Louis Watton of Shiply. “If lots of users are bouncing off of a page quickly, then you need to assess why that is. Are they not seeing the price they want? Not enough product images? No reviews or reasons to trust the site? The longer people stay on your site, the more familiar they get with your company, and the more likely you are to make a sale.”
The aptly named KPI Dashboard template allows you to see all of your important eCommerce metrics and KPIs, including bounce rate, users, sessions, engagement rate, and more.
Page Views Per Visit
Page views per visit is a measure of user engagement on your website. It shows how many pages a visitor views during a single session. A higher number indicates that visitors are finding your content interesting and relevant, which can lead to higher conversion rates.

Average Session Duration
The average session duration allows you to see how much time visitors spend on your website during a single visit. This KPI can provide insights into user engagement and the overall user experience on your website.

Traffic Sources
Understanding where your website traffic is coming from can help you optimize your marketing strategies and identify the most effective channels for customer acquisition.
Mobile Site Traffic
Mobile shopping is becoming the norm, and tracking mobile site traffic has become crucial for eCommerce businesses. It can help you understand how well your website is optimized for mobile users and identify opportunities for improvement.
PRO TIP: Save Time Creating Your Google Analytics 4 Traffic Dashboard
Yes, you can DIY in Google Analytics 4, but what if you would prefer a simpler, easier route? After all, once you learn how it’s done, you still have to choose the right metrics and design your custom dashboard to answer the important questions your stakeholders have, for example:
- How many people are visiting my website?
- Which channels bring in the most users?
- How engaged are my users?
- How well is my website keyword optimization performing?
and more…
Now you can benefit from the experience of Google Analytics experts, who have put together a great Databox template showing all the most important website traffic KPIs. This template allows for easy integration with scheduled report delivery. It’s simple to implement and start using as a standalone dashboard or in marketing reports!
You can easily set it up in just a few clicks – no coding required.
To set up the dashboard, follow these 3 simple steps:
Step 1: Get the template
Step 2: Connect your Google Analytics 4 account with Databox.
Step 3: Watch your dashboard populate in seconds.
Return on Investment (ROI)
“If I had to choose one KPI to focus on for e-commerce websites, it would be ROI,” says Jonathan Aufray of Growth Hackers. “If you’re able to get a positive ROI with your product, you can reinvest your profits into growth, traffic, ads, and conversion rate optimization so you can scale.”
“To get a positive ROI, keep improving your conversion rate while decreasing your lead costs.”

Return on Ad Spend (ROAS)
“Return on advertising spend is an important metric for e-commerce businesses that use online advertising,” says Anthony Capetola of Sales & Orders. “ROAS lets you assess how effective an ad campaign is, allowing you to determine what adjustments need to be made for any given advertising campaign.”
Monica Eaton-Cardone of Chargebacks911 agrees: “Monitoring return on ad spend ensures your efforts are leading to an increase in revenue.”Track your ROAS in the Facebook Ad Campaign for eCommerce dashboard in addition to metrics like CTR, page likes, CPM, link clicks, and many more.

Influencer ROI
Josh Brown of Helpjuice suggests tracking influencer ROI if your eCommerce business uses influencer marketing. “More and more e-commerce businesses are relying on influencers to help them increase their reach/brand awareness, traffic, and sales.”
The problem is that too many businesses look at vanity metrics like how many likes/shares/comments an influencer post received. Instead, you should measure if that activity helps you reach your marketing goals (and ultimately a positive ROI).”

Newsletter Subscribers
The number of newsletter subscribers can be a valuable KPI for eCommerce businesses. It’s the number of people who are interested in your products or services and have opted to receive regular updates from you.

Email Open Rate
The email open rate is a measure of how many people are opening your emails. A high email open rate indicates that your email marketing efforts are effective and that your emails are resonating with your audience.
It’s super easy to track email open rates with this Klaviyo Dashboard template. You can also improve your email marketing campaigns by monitoring additional eCommerce metrics and KPIs like CTR, marked as spam, CTOR, bounced emails, and more.

Email Click-Through Rate (CTR)
The email click-through rate is a measure of how many people click on the links in your emails. A high email CTR indicates that your emails are not only being opened but are also compelling enough to prompt action from your subscribers.

Unsubscribes
The unsubscribe rate is the percentage of your email subscribers who opt out of your email list. A high unsubscribe rate could indicate that your email content is not resonating with your audience or that you are sending emails too frequently.

Social Media Followers
The number of social media followers is a measure of your brand’s popularity and reach on social media platforms. It can provide insights into the effectiveness of your social media marketing strategies.
Social Media Engagement Rate
The social media engagement rate is a measure of how actively your followers are interacting with your content on social media. It can provide insights into the quality of your content and how well it resonates with your audience.
Cost Per Click (CPC)
Cost per click is a key metric for eCommerce businesses that use pay-per-click advertising. It represents the average amount you pay for each click on your ads. Monitoring your CPC can help you manage your advertising budget and optimize your PPC campaigns for better ROI.
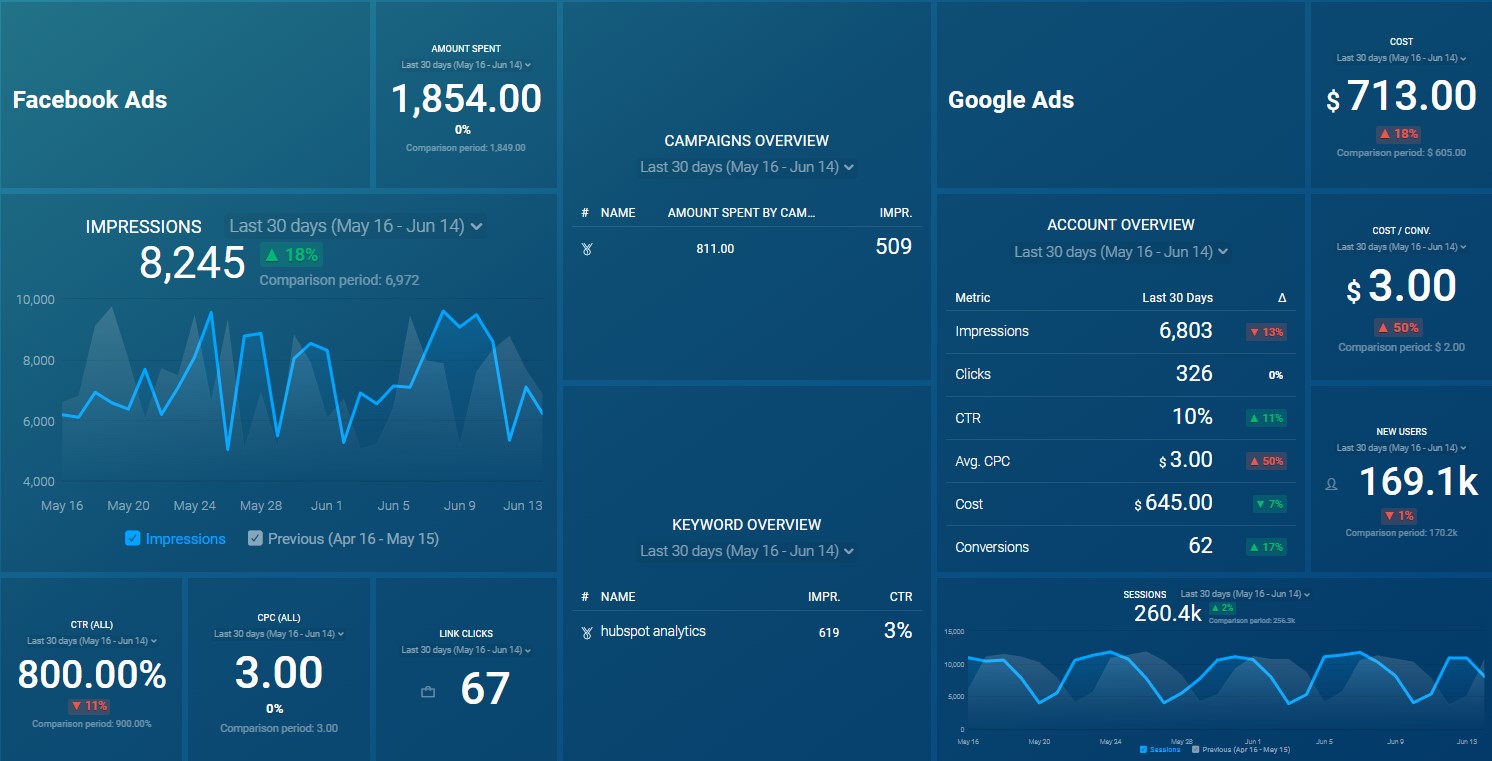
In order to stay on top of CPC and other top eCommerce KPIs, you can use the Facebook & Google Ads dashboard template and monitor how your business is performing.
Organic Search Rankings
Syed Ali Hasan of Film Jackets recommends tracking the organic search rankings for your eCommerce site.
“Search rankings are important for measuring the growth performance of an e-commerce store. This will indicate whether your on-page and off-page efforts are working or not.”
“For example, if your desired landing page is ranking on the second page of Google, your next step is to check if it is properly optimized. Is the content creating any relevancy with the page? Does it have the required keywords?”
Clicks
Clicks are a basic but crucial KPI for eCommerce businesses. They represent the number of times users have clicked on your ads, links or any clickable element on your website. Monitoring your clicks can help you understand user behavior and optimize your website for better user experience and conversion rates.This GA4 SEO dashboard makes it incredibly easy to track clicks and countless other eCommerce metrics by medium, period, or other factors.

Most Important eCommerce KPIs for Tracking Customer Service Performance
AI-powered tools are revolutionizing customer service by reducing average resolution time and improving first response time through automated chatbots. AI can also analyze large volumes of customer inquiries, enabling personalized responses at scale. Tools like Zendesk AI or ChatGPT-based support systems can track these improvements while offering insights into frequently asked questions and recurring issues, enhancing overall customer satisfaction (CSAT) scores. Customer service performance KPIs are key to evaluating your customer service quality and the success of your customer retention strategies. They help gauge customer satisfaction, measure service efficiency and assess the success of your customer retention strategies.
- Customer Retention Rate
- Customer Satisfaction (CSAT) Score
- Hit Rate
- Number Of Customer Service Tickets
- Average Resolution Time
- First Response Time
Customer Retention Rate
Nate Masterson of Maple Holistics emphasizes the importance of customer retention rate for long-term success.
“Having customers come back for more is a sure sign that your eCommerce efforts are not being wasted, especially since repeat customers often refer to new customers.”
Otmara Diaz-Cooper of Diaz & Cooper agrees: “A Harvard Business School study shows that just a 5% increase in retention can increase profits anywhere from 25% to 95%. Finding ways to get more business out of existing customers is hugely profitable and cost-effective.”

Customer Satisfaction (CSAT) Score
Customer satisfaction is typically measured by polling customers about their experience.According to David Hoos of The Good, making improvements to overall customer performance will have a positive impact not only on the conversion rate but also on ROAS, average order value, abandonment rate, and lifetime value.

Hit Rate
Hit rate measures the number of successful customer interactions compared to the total number of interactions. A high hit rate indicates that your customer service team is effectively resolving customer issues.
Number Of Customer Service Tickets
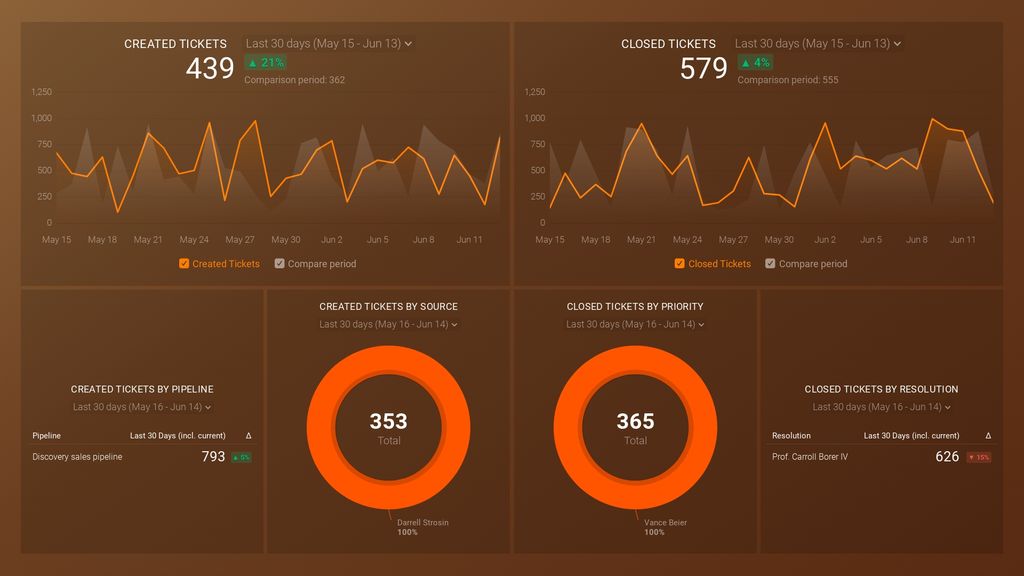
The number of customer service tickets can provide insight into the volume of customer inquiries and issues. This can be tracked using a service like HubSpot, which provides insights into your tickets, productivity, open vs. closed tickets ratio, and more.
If you want to get insights into your tickets, productivity, open vs. closed tickets ratio, and other eCommerce metrics, this HubSpot Service dashboard is the perfect tool.
Average Resolution Time
Average resolution time is a measure of how long it takes your customer service team to resolve customer issues. A shorter resolution time can lead to higher customer satisfaction.

First Response Time
First response time is the amount of time it takes for your customer service team to first respond to a customer inquiry or support ticket. Keeping this time as low as possible is crucial for customer satisfaction.
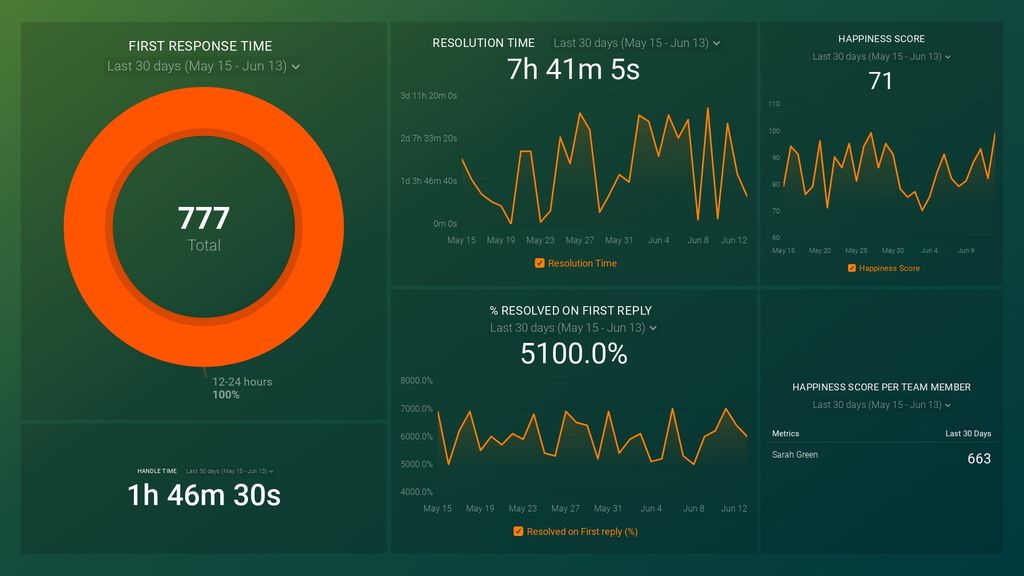
This can be tracked using a tool like Help Scout, which allows you to view the number of minutes, hours, or days it takes for your customer agents to first respond to a customer inquiry or support ticket.If you’re using HelpScout to monitor the effectiveness of your customer service team, then HelpScout for Customer Support Dashboard will help you keep an eye on important metrics, including fist response time, handle time, resolution time, and others.
The Best Tools for Tracking eCommerce Analytics
Having the right analytics tools at your disposal is crucial for eCommerce businesses, and there’s no dearth of platforms available.
When it comes to our respondents, Google Analytics is in the strong lead, used by 53% of businesses for its comprehensive insights into website traffic, user behavior, and conversion metrics.
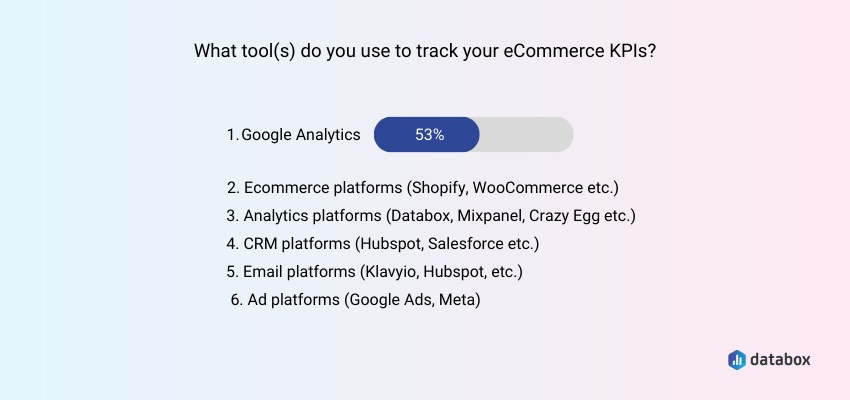
Ecommerce platforms are also popular choices, offering built-in analytics that cater specifically to online retail metrics. Similarly, specialized analytics tools provide advanced capabilities, including user segmentation, funnel analysis, and heatmaps.
With the shift to event-based tracking, Google Analytics 4 (GA4) has replaced Universal Analytics, offering a more comprehensive view of user interactions across devices and platforms. GA4 is particularly valuable for eCommerce businesses due to its advanced machine-learning capabilities, predictive analytics, and privacy-first design. If you haven’t already transitioned to GA4, now is the time to leverage its power for tracking KPIs like customer behavior, attribution modeling, and revenue trends.
Additionally, consider incorporating AI-powered analytics tools, such as Shopify’s new AI-driven insights, which can predict trends and offer data-driven recommendations. Furthermore, tools like ChatGPT eCommerce plugins provide real-time customer support data and enhance user engagement effectively.
CRM platforms are also indispensable, primarily for tracking customer interactions, lead conversion, and retention. Email platforms, on the other hand, offer valuable insights into email marketing performance.
Finally, ad platforms are used to monitor ad performance, providing data on impressions, clicks, and conversions, essential for creating comprehensive marketing reports.
However, juggling multiple platforms can be a challenge. Thankfully, a comprehensive solution like Databox allows businesses to consolidate data from all these tools into a single view, thereby simplifying the process of monitoring eCommerce KPIs and ultimately making data-driven decisions more efficiently.
Empower Your eCommerce Success with Databox
Staying ahead of the curve requires a keen understanding of your business performance. KPIs serve as your compass, guiding your decisions and strategies toward success. From sales and marketing to customer service, each facet of your business has unique KPIs that reflect its health and growth potential.
However, tracking these KPIs across multiple platforms can be a daunting task with a plethora of tools available and time-consuming manual transfers between various spreadsheets and databases.
Fortunately, you don’t have to do it alone; Databox has your back.
Our software is designed to help you create professional dashboards with ease:
- Connect your data source from our wide range of integrations
- Select the metrics you wish to track and place them on your dashboard
- Watch as your data transforms into visually appealing and easy-to-understand insights
Databox offers over 400 templates that you can customize with your data, or you can create a dashboard from scratch — no coding required. If you end up stumped, our helpful team will be ready to assist.
Regardless of the aspect of your ecommerce performance you wish to track, Databox provides real-time insights into all key metrics in one place.
Don’t let the complexity of data tracking slow down your eCommerce growth. Harness the power of business intelligence and transform your KPI monitoring into a streamlined, efficient process. Sign up for a free trial and start your journey toward data-driven success today.


