Uses one-click integrations:
-
 Google Analytics 4
-
 Facebook Ads
-
 Shopify
If you don't use Google Analytics 4, Facebook Ads or Shopify, you can pull data from any of our 130+ one-click, native integrations or from spreadsheets, databases and other APIs.
Try this dashboard for free
Google Analytics 4 metrics included in this template
-
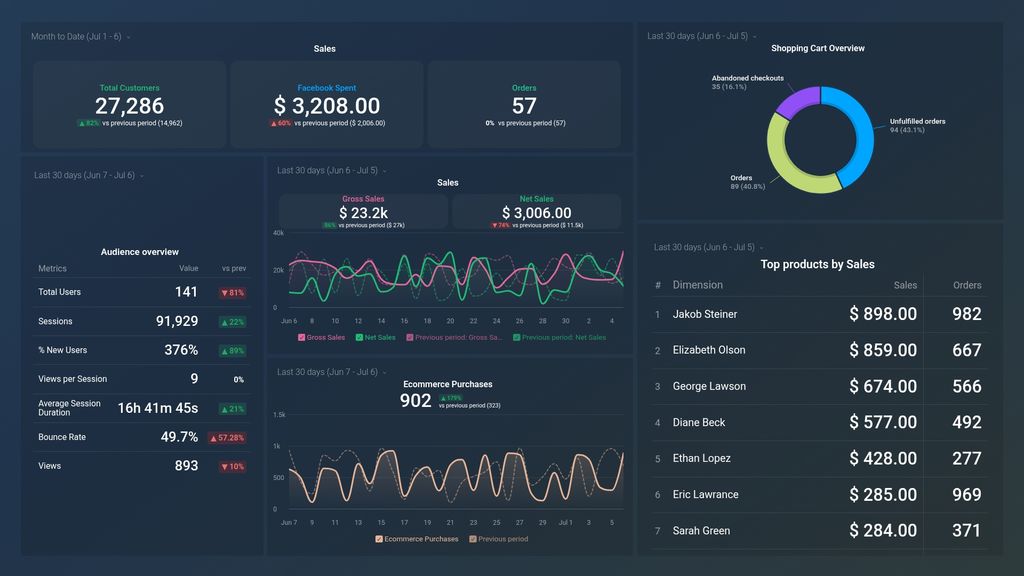
Ecommerce Purchases
The Ecommerce Purchases metric measures the total number of completed purchases made on an ecommerce website, including the quantity of items purchased and revenue generated.
Shopify metrics included in this template
-
Unfulfilled Orders
Unfulfilled orders is a metric that measures the number of orders that have not yet been shipped or delivered to the customer. It helps merchants keep track of outstanding orders and ensure timely fulfillment.