Uses one-click integrations:
-
 Shopify
If you don't use Shopify, you can pull data from any of our 130+ one-click, native integrations or from spreadsheets, databases and other APIs.
Try this dashboard for free
Shopify metrics included in this template
-
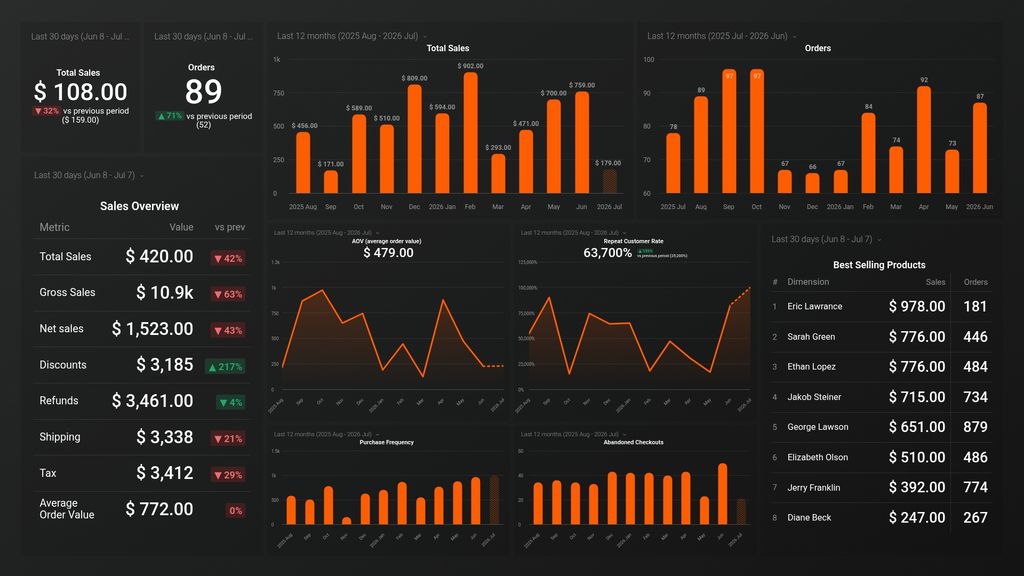
Abandoned Checkouts
Abandoned checkouts metric refers to the number of customers who added items to their cart but failed to complete the purchase, which can help merchants identify potential issues in the checkout process.
-
Discounts
Discounts metric shows the total amount of discounts offered by the store to customers over a given period of time. It helps in analyzing the effectiveness of promotional activities and their impact on the store's revenue.
-
Net Sales
Net sales is the total sales revenue generated by a business after accounting for returns, discounts, and other deductions. It is a key metric to measure a company's profitability.
-
Net Quantity by Top Products
The Net Quantity by Top products metric provides insight into the overall sales performance of a store's top products by tracking the total quantity sold versus the quantity returned or canceled, resulting in a net quantity sold.
-
Returns
Returns metric measures the number and percentage of orders that are returned by customers. This helps to track customer satisfaction and identify potential issues with product quality or delivery.
-
Gross Sales by Top products
Equates to product Selling Price x Ordered Quantity during the specified Date Range split up by Top Sold Products.
- Purchase Frequency
-
Shipping
Number of Shipping Charges associated with a Sale or return during the specified Date Range.
-
Tax
Number of Taxes associated with a Sale or return during the specified Date Range.
-
Total Sales
Equates to Gross Sales - Discounts - Returns + Taxes + Shipping Charges during the specified Date Range. Total Sales will be a positive number for a Sale on the date that an order was placed, and a negative number for a return on the date that an order was Refunded.