Uses one-click integrations:
-
 Xero
Xero
-
 WooCommerce
If you don't use Xero or WooCommerce, you can pull data from any of our 130+ one-click, native integrations or from spreadsheets, databases and other APIs.
Try this dashboard for free
Xero metrics included in this template
-
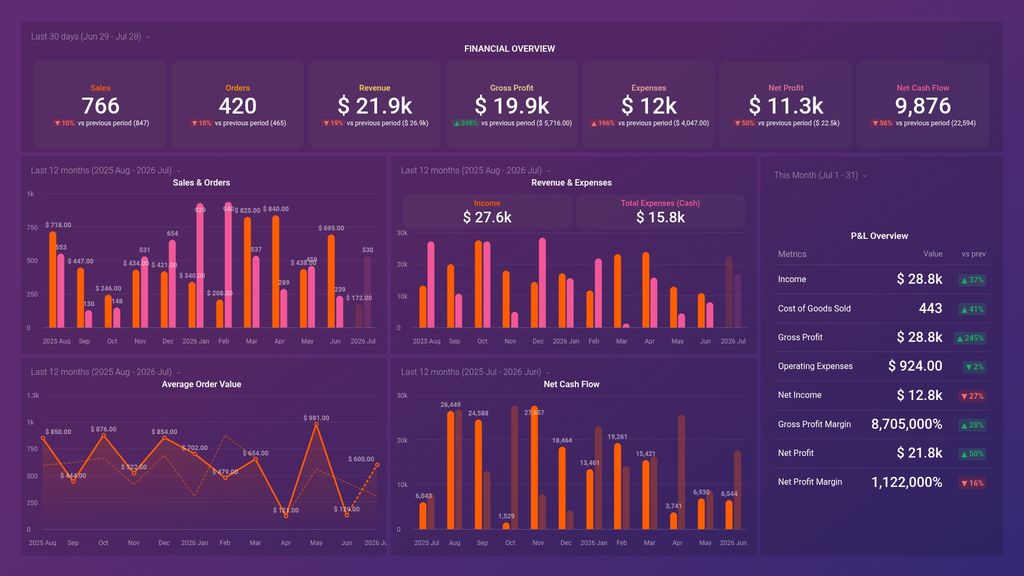
Total Operating Expenses
Operating Expenses metric in Xero represents the sum of all expenses incurred by a business during its normal operations, including salaries, rent, utilities, and other overhead costs.
WooCommerce metrics included in this template
-
Gross Sales
Gross sales from the Revenue report in WooCommerce Analytics, representing overall revenue generated.
-
Orders (Revenue)
Number of orders recorded in the Revenue report of WooCommerce Analytics, indicating sales activity and performance.
- Average Order Value