Uses one-click integrations:
-
 Xero
Xero
If you don't use Xero, you can pull data from any of our 130+ one-click, native integrations or from spreadsheets, databases and other APIs.
Try this dashboard for freeWhat you’ll learn from this Xero Dashboard template:
Get quick updates on your book-keeping and accounting KPIs without hassle. Connect your Xero account and learn:
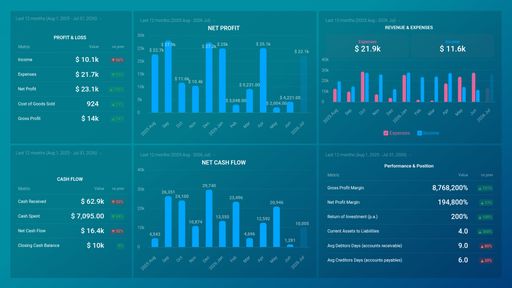
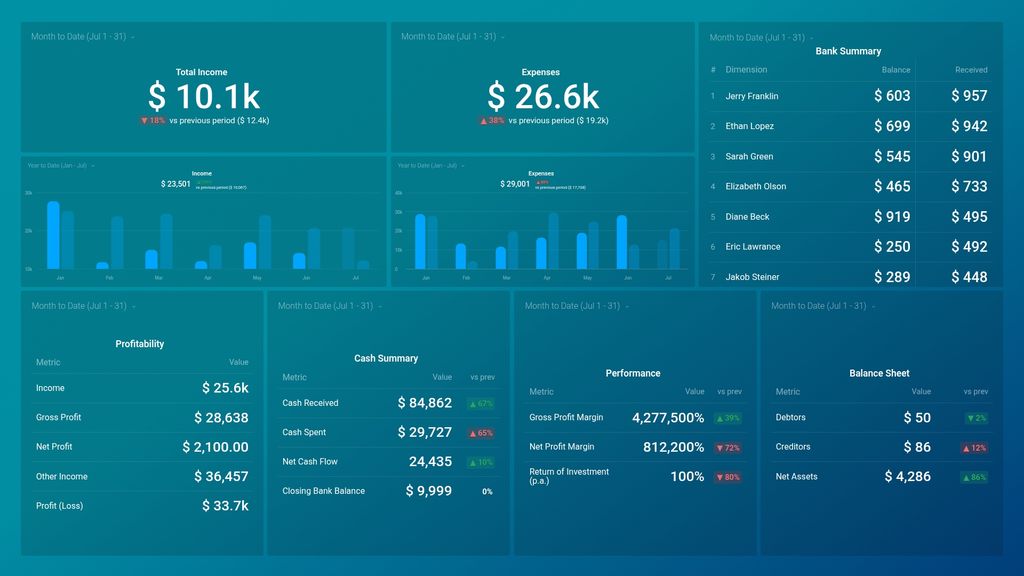
- How do we keep track of our monthly income? Find out how much you’re making from the purchase of your products and/or services within a given month. Monitor your income stream and identify key periods of growth and decline in money coming in and take the required steps to get back on track if your income flow is down.
- How do we keep track of our monthly expenses? See how much your business spends monthly on operating and non-operating expenses. It is important to track this data as it lets you know if your expenses are higher or lower than your revenue; that way, you’re able to forecast your expenses accurately during the months your income is lower.
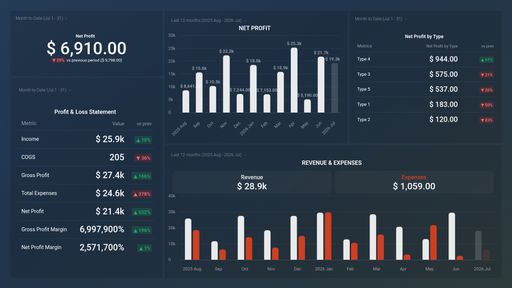
- How do we measure our business’ financial performance? Track and visually monitor your most important financial KPIs/ profitability metrics, such as net profit/loss, gross profit/loss, income, expenses, return on investment, and more. Use this data to map out future growth opportunities for your business.
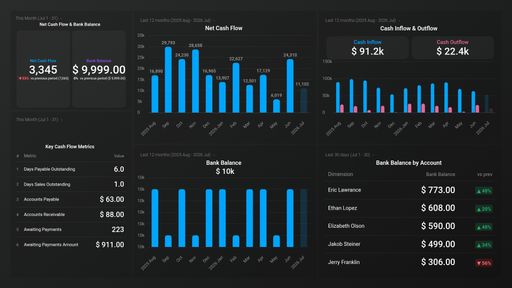
- How do I track cash transactions that occurred during a specific period? See how cash is distributed within and out of your business during a period of time. Keep your eye on how much cash your business receives and spends within a specific month, as well as cash surplus and your closing balance.
- How do I track a bank transaction? See how cash comes in and goes out of your business’ bank accounts. Get up-to-date information on the state of your finances in regards to bank balance after withdrawals or transfers and deposits to your accounts.
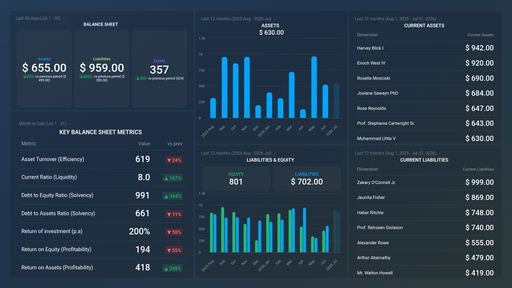
- How do we keep track of assets and liabilities? Assess the financial health of your business at any given point in time. Keep tabs on net assets, as well as money owed to you (debtors) and money you owe to other people (creditors). Based on this data follow up on due payments to avoid paying excessive interest charges.
Pull additional data using our deep integration with Xero
What other campaign metrics can you track and visualize with our Xero integration? Among others:
-
- Cash flow & Cash balance
- Accounts receivable and payable
- Consolidated net income
- Net sales
- Gross profit margin
- Top customers, vendors and products
There are many different metrics and metric combinations you can track using this integration. And in Databox, you can quickly visualize your most important financial metrics in various ways to help you create consolidated reports.
Read more about Databox’s Xero integration.
Xero metrics included in this template
-
Cash Received by Bank Account
The Cash Received by Bank Account metric tracks the total amount of cash received by a specific bank account over a given period of time. It includes all payments, deposits, and other sources of revenue that have been credited to the account.
-
Net Assets
Net Assets is the total value of an organization's assets minus its liabilities. It reflects the overall financial health of the business and is used to determine the company's ability to pay off long-term debt and generate future profits.
-
Other Income
Other Income is a revenue source recorded in Xero that is not derived from a business's primary activity or core operations. It includes proceeds from one-time events, investments, or sale of assets.
- Profit (Loss)