


Table of contents
With Databox’s new Data Calculations feature, one of the most challenging aspects of performance tracking has just been made infinitely easier.
As anyone who’s ever been in a reporting meeting knows, most out-of-the-box performance metrics fall short of telling the whole story.
To accurately gauge success and efficiency, context and correlation are needed. (This is where most meetings go off the rails as people dig through screens and spreadsheets to try and find the answers.)
Some examples…
- Visitors are great, but at what percentage are those visitors becoming leads? (And at what percentage are those leads converting to customers?)
- Clicks and signups from a Facebook Ad campaign are great, but has anyone calculated the return on ad spend?
- Customer acquisition is a common goal, but without calculating customer acquisition cost (CAC), you might be spending more than you can afford.
Unfortunately, calculating KPIs like these can be tricky, especially since the inputs into these formulas are usually captured and stored in different systems.
But what if Databox could handle all that heavy lifting for you?
Data Calculations was released as a beta feature last year. In that time, we’ve collected great feedback from users and have expanded Data Calculation’s ability to handle any equation with any metric. Today, we’re over-the-moon excited to introduce the public version of Data Calculations.
Data Calculations enable you to create on-the-fly calculations, regardless of whether the fields for calculations originate from a single data source or different data sources.
Even if you push your custom data into Databox or have a SQL database hooked up to Databox, you can combine that data, too.
What Data Calculations can do
Aggregate metrics from multiple sources

Sometimes companies, or teams, need an easy way to view the aggregate metrics from multiple accounts.
As the example above shows, some online shops use multiple payment providers: one for processing credit cards (Stripe), one for managing invoices (QuickBooks), and they might also use PayPal as an alternative payment provider. Through a simple formula, Data Calculations can add up all the revenue streams into one number that can be plotted in a line chart.
For marketers managing separate websites or brands, Data Calculations can come in very handy when reporting overall marketing and sales results.
Databox Premier Partner, Nextiny Marketing, has been using Data Calculations to add together HubSpot traffic, leads and sales activity metrics for one construction client who has four active real estate development websites.
“Before Data Calculations, we had to log into their four different HubSpot portals, enter all their key metrics into a spreadsheet and add them up. It took us hours each week.” said Nextiny’s CEO, Gabriel Marguglio.
Calculate rates
While absolute metrics like sessions, signups, sales, revenue, and cancellations are critical metrics, they don’t provide insight into the efficiency of your business and its people. By calculating ratios, you can identify important trends, draw correlations, and learn whether or not your performance is improving or worsening.
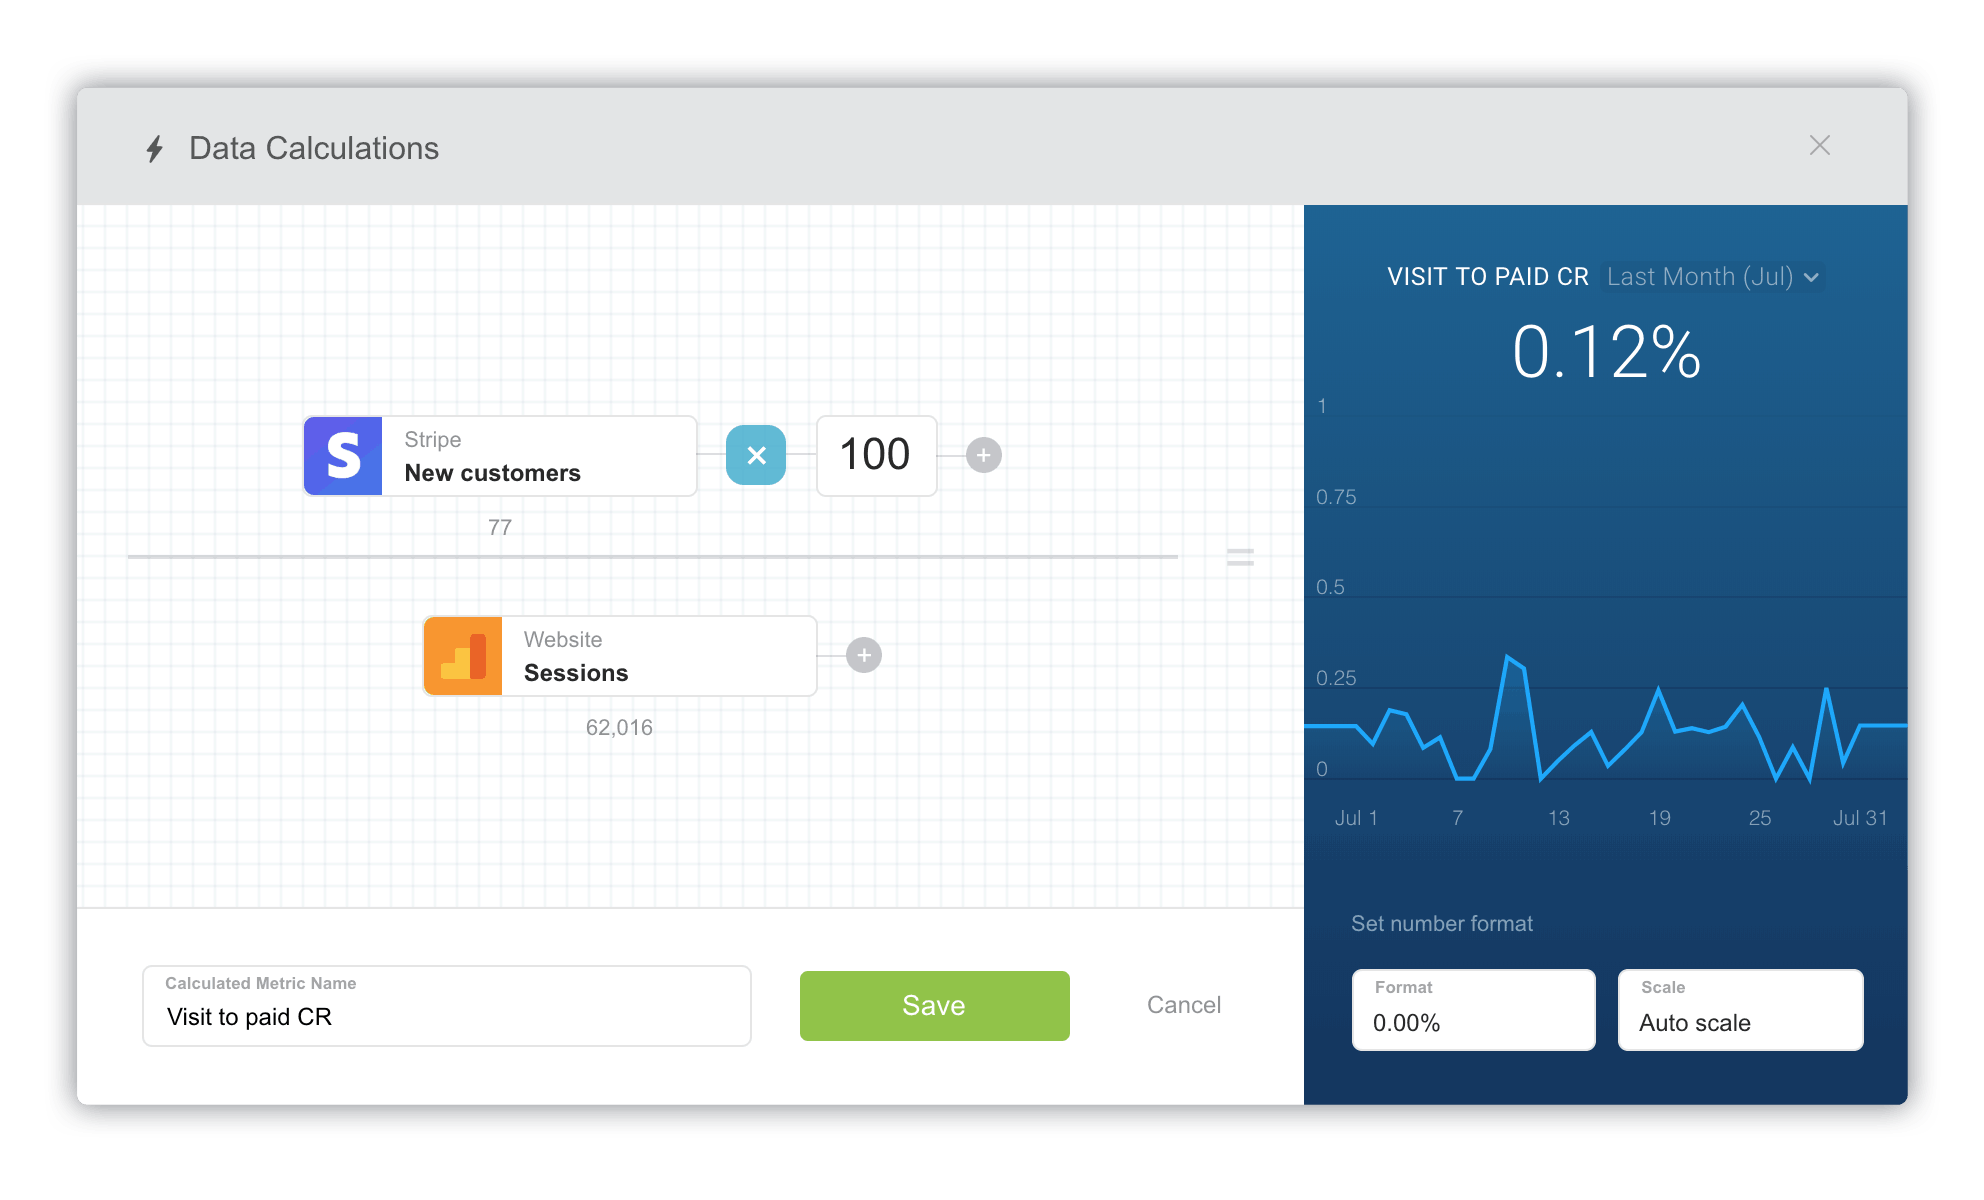
For example, while many companies track and celebrate the higher number of sessions their website receives each month, calculating the percentage of visitors that become paying customers (visit-to-paid conversion rate) is a more telling sign of a better marketing and sales plan.
Conversion rates, churn rates, growth rate–these are just a few examples of metrics you can create with Data Calculations.
Also, do you track your marketing and sales performance in different tools? From now on that won’t matter, as you can calculate conversion rates from data from multiple sources.
ROI and financial metrics
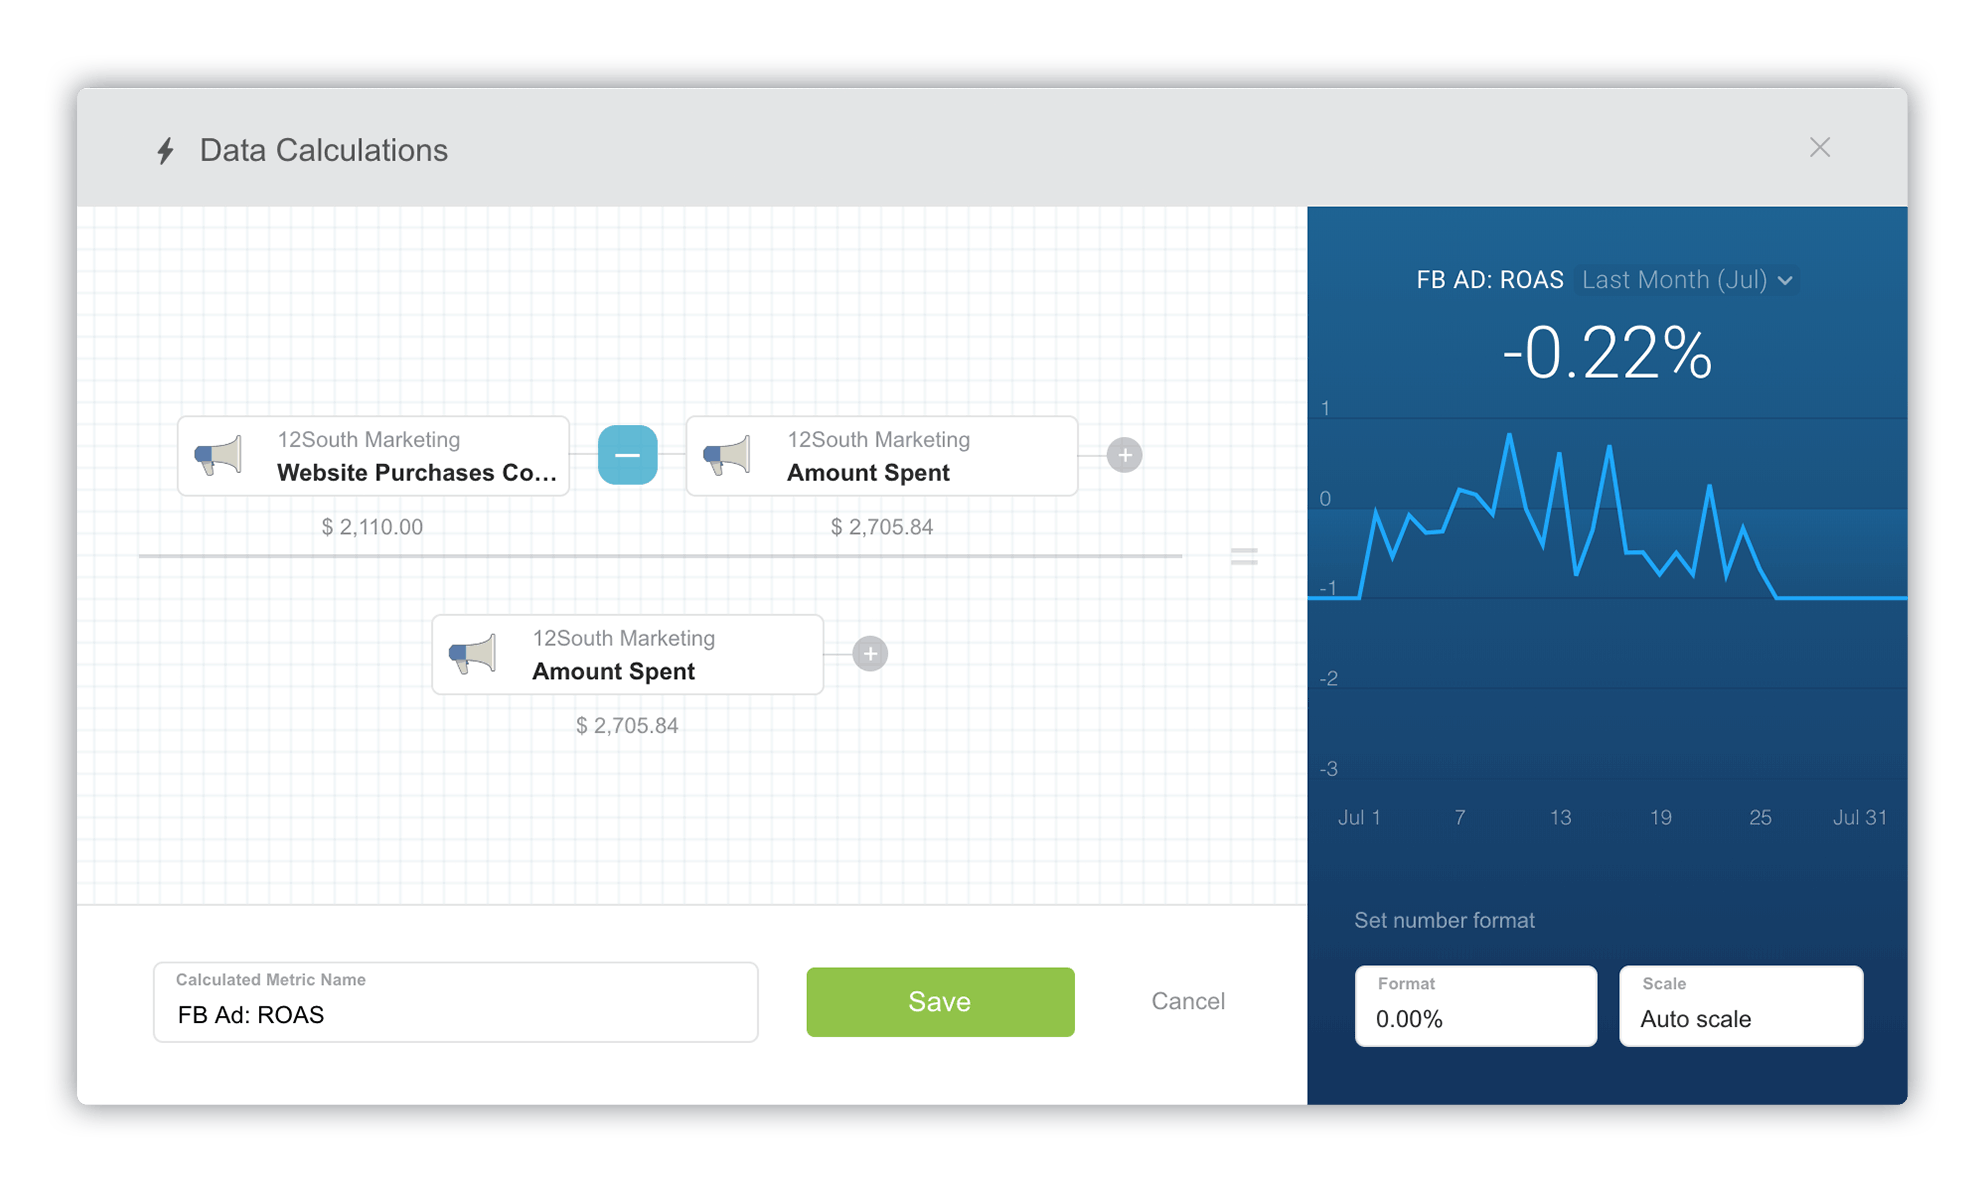
SaaS and financial metrics are other great examples of metrics that don’t come “out of the box” in most tools. With Data Calcuations, you can now calculate important metrics like average revenue per user (ARPU), customer acquisition cost (CAC) lifetime value (LTV), return on ad spend (ROAS), and others.
Under the hood improvements
Combine metrics of any type and source
With the new Data Calculations, we fixed all of the reported beta issues our users encountered when trying to combine metrics from different sources and of different types. We categorize every metric we pull from every data source by a plethora of criteria. This allows us to make it easy for non-technical users to quickly visualize data in the way that makes sense for that metric without understanding the underlying way the data is stored. It also helps us ensure that calculations are done correctly, regardless of how the data is stored or structured.
Use calculated metrics on dashboards, as goals or for alerts
We’ve also added full support for using calculated metrics throughout the app.
Want to plot your visit to lead conversion rate over time? You can do that by adding your Calculated Metric to a Databoard.
Want to set a goal to achieve a specific Return on Ad Spend (ROAS)? No problem.
Want to get notified if your sales close rate drops by 10%? Use an Alert.
Now, you can use a calculated metrics across all our features, just like any other metric.
Use calculated metrics in calculations
You can also use calculations in other calculations (ie calculating CAC / LTV; where CAC and LTV are both calculations, too).
Calculated metrics are going to be used in Databox Templates too, meaning you’ll be able to use calculations without building the calculations yourself. Of course, you’ll be able to edit it if you need to change the source of the data or the calculation formula itself.
Data Calculations Builder UI improvements
We’ve also made improvements to the Data Calculations Builder UI that makes it more intuitive:
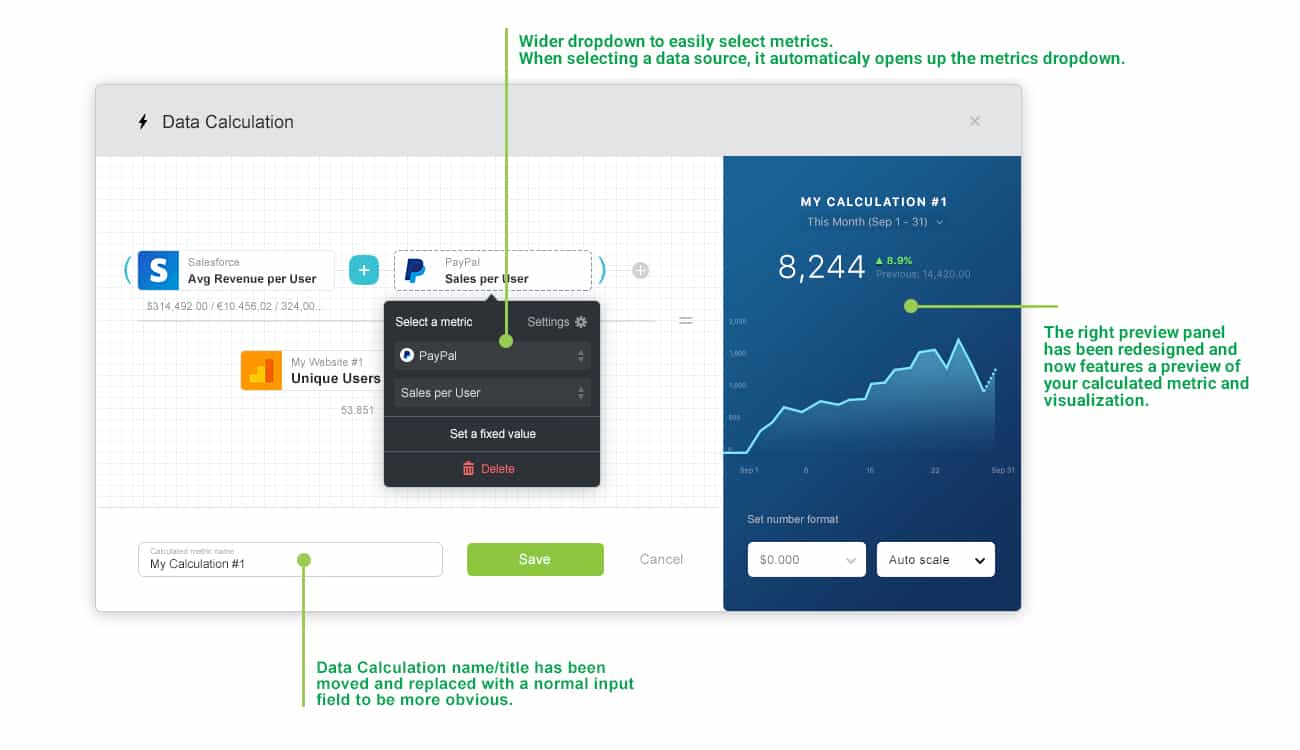
- When building a Data Calculation, your result will immediately be calculated and visualized on a chart. You’ll instantly know whether you’ve got the formula right, as every change will be calculated and visualized instantly.
- Small UI improvements on the form (the data source and metric select popups have been made wider to more easily select the desired metric. The field to name your Data Calculation has been moved down to be more obvious and consistent with other forms in Databox.)
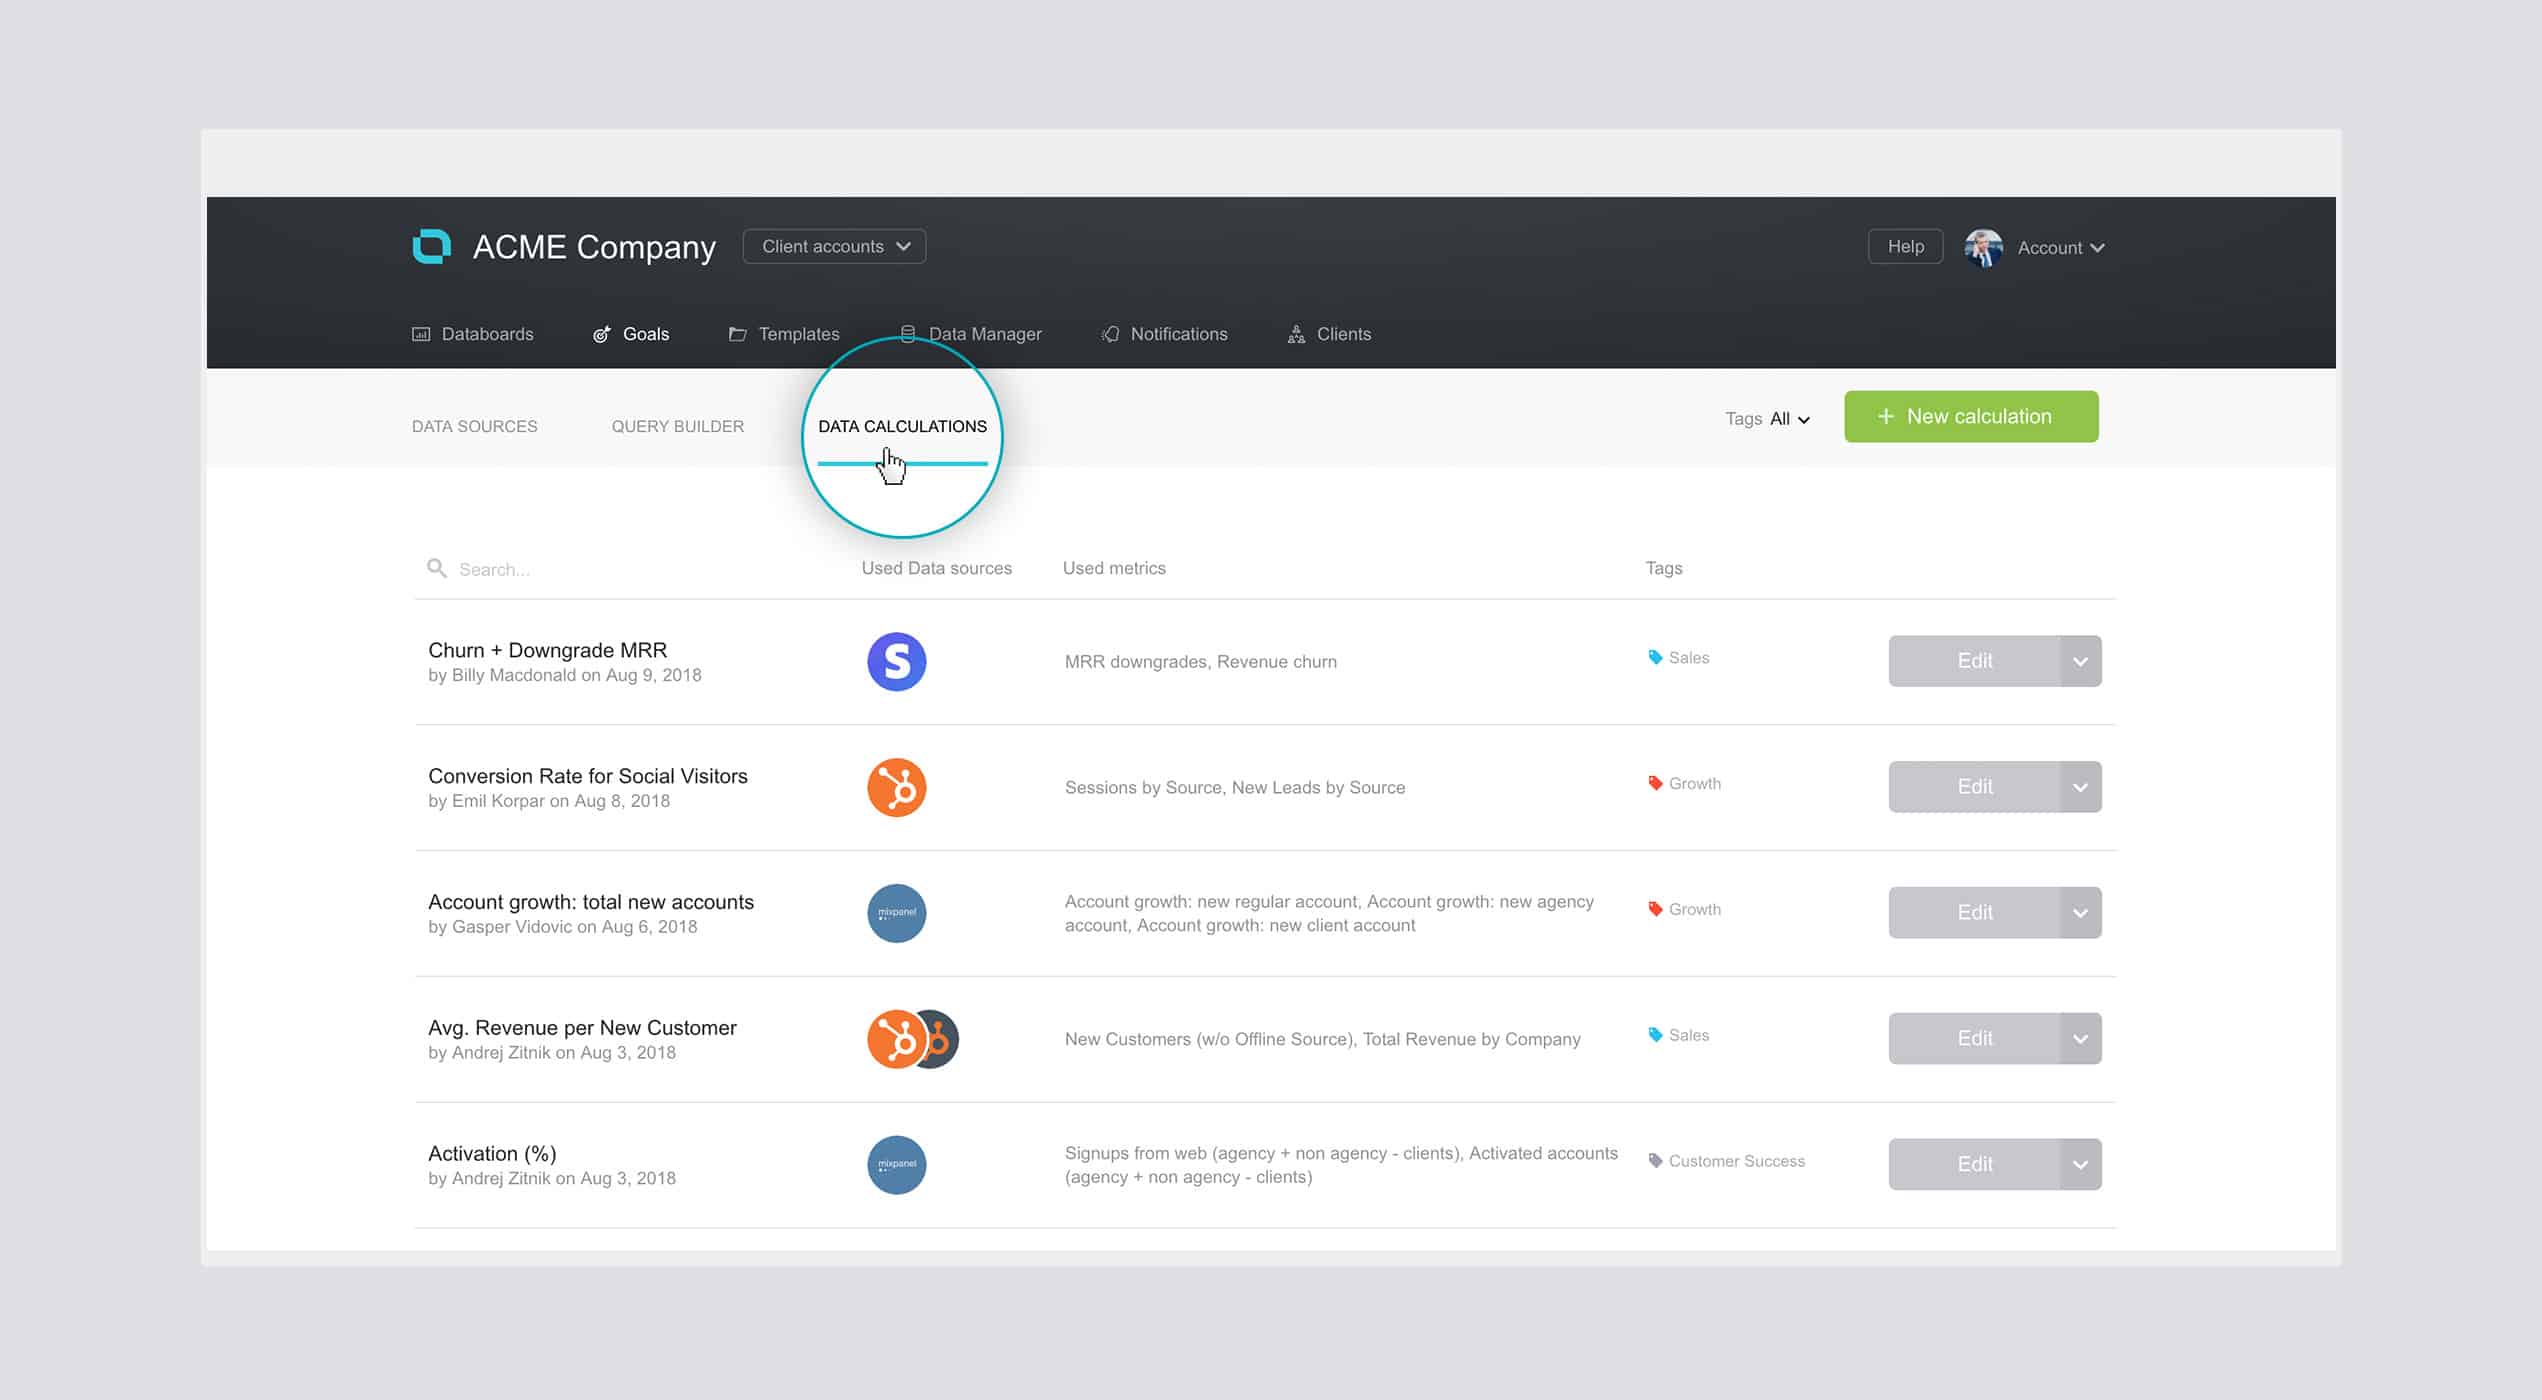
- A new and improved Data Calculations listing overview, so you can see all the Data Calculations you’ve created.
How to create a Data calculation
Once you’re in the Databox web application:
-
- Navigate to the Data Manager > Data Calculations tab. From there you can create and manage all your Data Calculations, as shown above. However, you can also create a Data Calculation from right within the Databox Designer as you’re building or editing a Databoard by using the right-hand metric-selection pane, as shown below.

By clicking on the “Calculate 2 or more metrics” link, the Data Calculations popup will open. There you can start up building your own calculation. - In the popup, click on “A“, “B” or “C” to add metrics for a new calculated metric. (See image below.)
- If you want to switch the operator or add parentheses, just click on “+” (or any operator sign in the calculation).
- Name your new calculated metric. (The calculated metric will be visible in the metric lists of all of the data sources the calculation uses.)
- Navigate to the Data Manager > Data Calculations tab. From there you can create and manage all your Data Calculations, as shown above. However, you can also create a Data Calculation from right within the Databox Designer as you’re building or editing a Databoard by using the right-hand metric-selection pane, as shown below.
- You can preview the calculation results on the right side. You can also switch the date range used for the preview. The list of available date ranges for each calculated metric will only include data ranges that are available for all of the metrics used in that calculation.
- Optionally, you can change the format and scale of the number. For example, if the number is a revenue figure, you can add the dollar sign. Or if you’d like to reduce or add decimal places, you can do that.
- Once you’re done, click the “Save” button to save your new calculation
- If you created the new calculation right from the Databox Designer, the new metric will be automatically selected and displayed. If you used the “Data Manager > Data calculations” page, then to use calculations on Databoards, select one of the data sources used in the calculation (if more than one) and then the metric under the segment “Calculated.”

Do you want to start playing with calculations?
Data Calculations are free to trial.
As a thank you to our beta-testers, you’ll continue to have access to Data Calculations on your current plan – no additional charge. Existing users who already have access to Data Calculations, just log in.
For new or existing Free or Basic users, Data Calculations is only included in our Plus and Business plans. For our agency customers, Data Calculations are available in our Agency Basic plan for use in your own account only. Agencies who want to create Data Calculations inside Client Accounts will need to be on an Agency Plus or Agency Business account.
If Data Calculations are not available in your current plan, request a free trial of Data Calculations via our support team.


