Uses one-click integrations:
-
 Xero
Xero
If you don't use Xero, you can pull data from any of our 130+ one-click, native integrations or from spreadsheets, databases and other APIs.
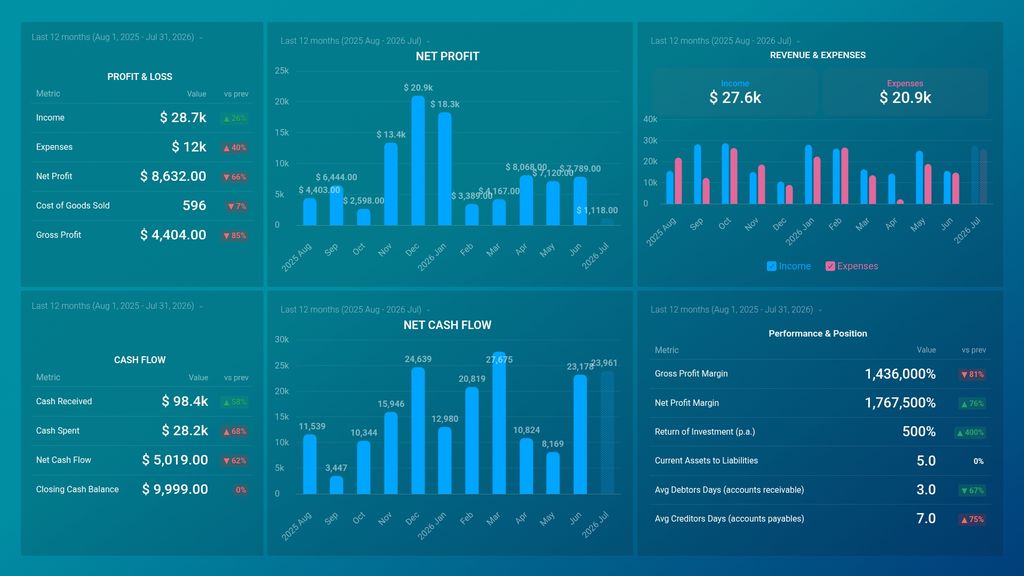
Try this dashboard for freeWhat you’ll learn from this Xero Financials Overview Dashboard template
Get quick updates on your book-keeping and accounting KPIs without hassle. Connect your Xero account and learn:
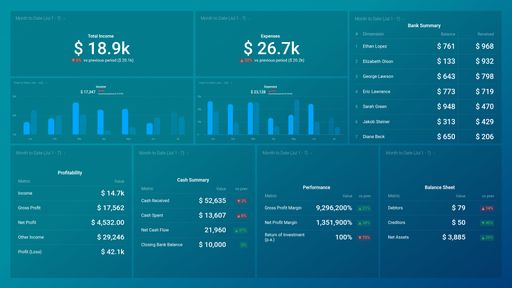
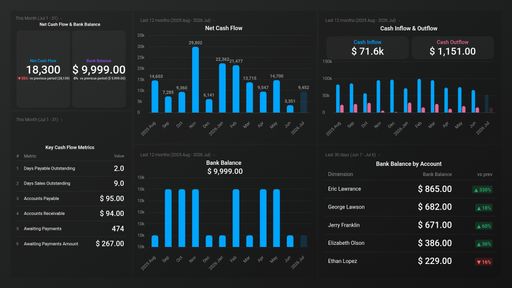
- How do you keep track of your cash flow? Find out how much you’re making from the purchase of your products and/or services within a given time period. Monitor your cash flow stream and identify key periods of growth and decline in money coming in and take the required steps to get back on track if your cash flow is down.
- How do you keep track of our monthly expenses? See how much your business spends monthly on operating and non-operating expenses. It is important to track this data as it lets you know if your expenses are higher or lower than your revenue; that way, you’re able to forecast your expenses accurately during the months your income is lower.
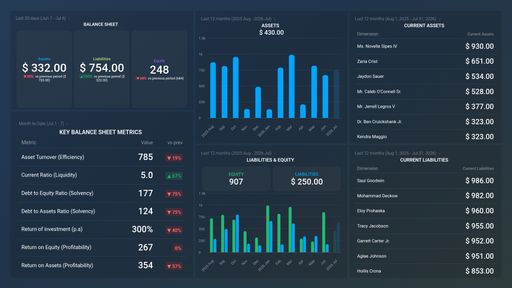
- How do you measure our business’ financial performance and position? Track and visually monitor your most important financial KPIs - profitability metrics, such as net profit margin, gross profit margin, ROI, current assets to liabilities and more. Use this data to map out future growth opportunities for your business.
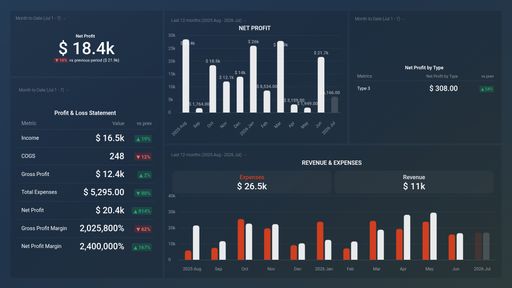
- Keep an eye on your profit and loss KPIs Track and visually monitor your most important financial KPIs like total income, expenses, cost of goods sold and more. You can use this data to gain insights in to the health of your business and decide if a change in sales strategy is needed.
- How do you keep track of assets and liabilities? Assess the financial health of your business at any given point in time. Keep tabs on net assets, as well as money owed to you (debtors) and money you owe to other people (creditors). Based on this data follow up on due payments to avoid paying excessive interest charges.
Pull additional data using our deep integration with Xero
What other campaign metrics can you track and visualize with our Xero integration? Among others:
- Cash flow & Cash balance
- Accounts receivable and payable
- Consolidated net income
- Net sales
- Gross profit margin
- Top customers, vendors and products
There are many different metrics and metric combinations you can track using this integration. And in Databox, you can quickly visualize your most important financial metrics in various ways to help you create consolidated reports.
Read more about Databox’s Xero integration.
Explore more Xero dashboards.