Uses one-click integrations:
-
 Xero
Xero
If you don't use Xero, you can pull data from any of our 130+ one-click, native integrations or from spreadsheets, databases and other APIs.
Try this dashboard for free
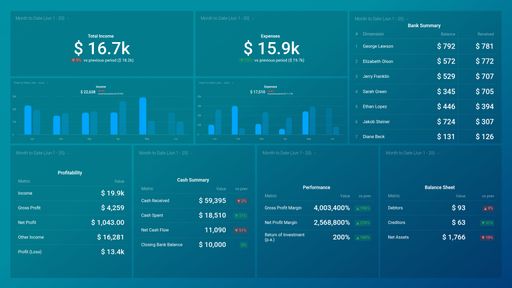
Xero metrics included in this template
-
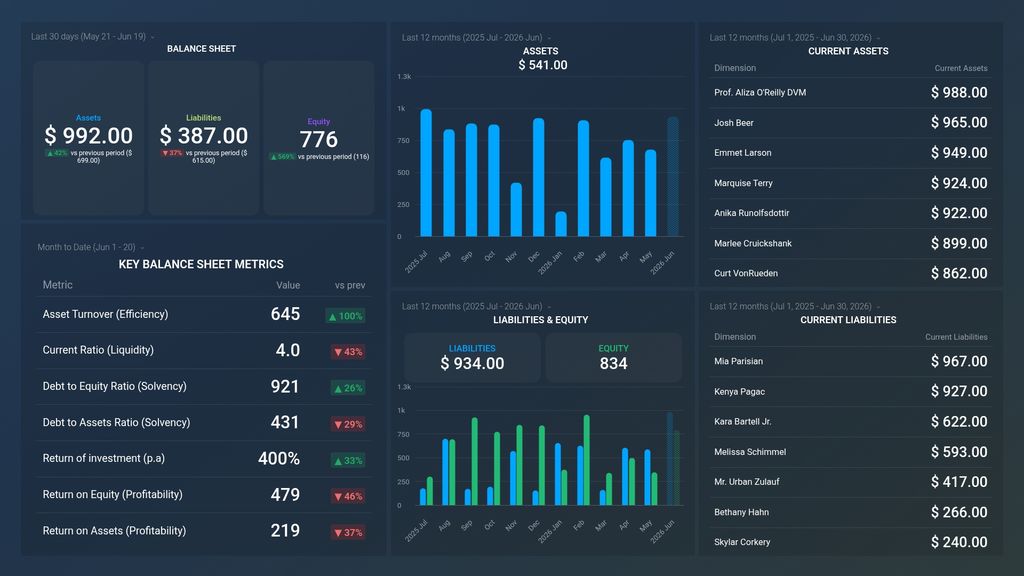
Current Assets to Liabilities
Current Assets to Liabilities metric compares the amount of short-term resources available to a company to meet its current obligations. It is a measure of liquidity and financial health.
-
Return of Investment (p.a.)
Return on Investment (ROI) is a financial metric used to evaluate the profitability of an investment. It measures the gain or loss of an investment relative to the initial cost, expressed as a percentage per year (p.a.).
- Equity - Xero
-
Total Assets
Assets represents the total value of an organization's resources, including cash, accounts receivable, inventory, property, and equipment.
-
Total Liabilities
Liabilities is a financial metric that shows the total amount of obligations owed by a business to creditors and other parties, including loans, accounts payable, and accrued expenses.
-
Current Liabilities by Liability
The Current Liabilities by Liability metric measures the proportion of a company's short-term debts compared to their long-term debts, providing insight into the company's ability to meet its obligations in the near future.