Uses one-click integrations:
-
 Xero
Xero
If you don't use Xero, you can pull data from any of our 130+ one-click, native integrations or from spreadsheets, databases and other APIs.
Try this dashboard for free
Xero metrics included in this template
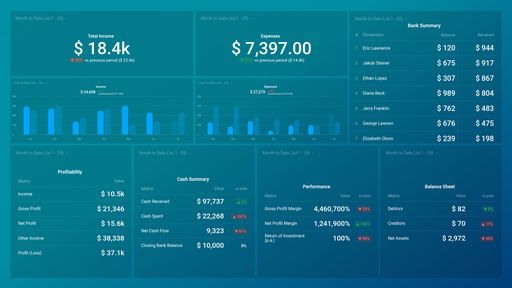
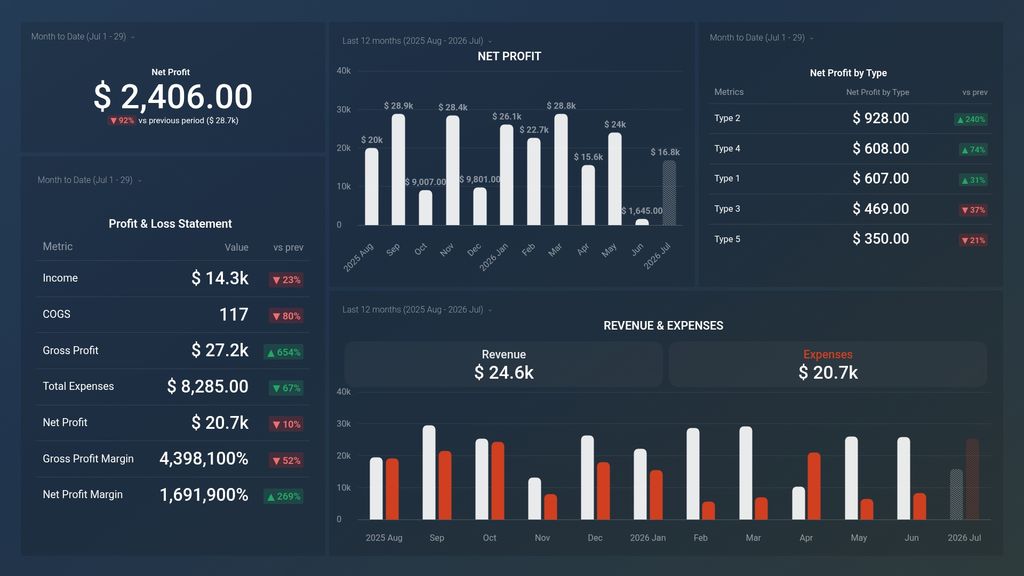
- Expenses
-
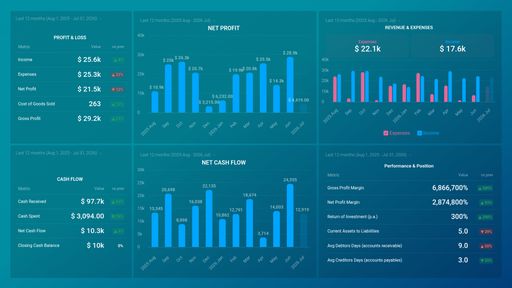
Gross Profit
Gross Profit is a financial metric that shows the profit earned by a business after deducting the cost of goods sold from its revenue. It represents the amount of money left after accounting for the direct expenses associated with producing and selling a particular product or service.
-
Gross Profit Margin
Gross Profit Margin is a financial metric that measures how much profit a company makes after deducting the cost of goods sold from its revenue.
- Income
-
Net Profit
Net profit is the amount of revenue a business earns after deducting all expenses, including taxes and interest. It reflects a company's overall profitability and is a key measure of financial success.
-
Net Profit Margin
Net Profit Margin is a financial metric that represents the percentage of profits earned from revenue after all expenses, including taxes and interest, are subtracted.
- Cost of Goods Sold
-
Total Income
Income is the sum of all revenue earned by a business during a defined period of time, including sales, services, and other sources of income.
-
Profit and Loss by Type
Profit and Loss by Type shows the profitability of your business by categorizing income and expenses into specific types like sales, cost of goods sold, and operating expenses.