Uses one-click integrations:
-
 QuickBooks
-
 BigCommerce
If you don't use QuickBooks or BigCommerce, you can pull data from any of our 130+ one-click, native integrations or from spreadsheets, databases and other APIs.
Try this dashboard for free
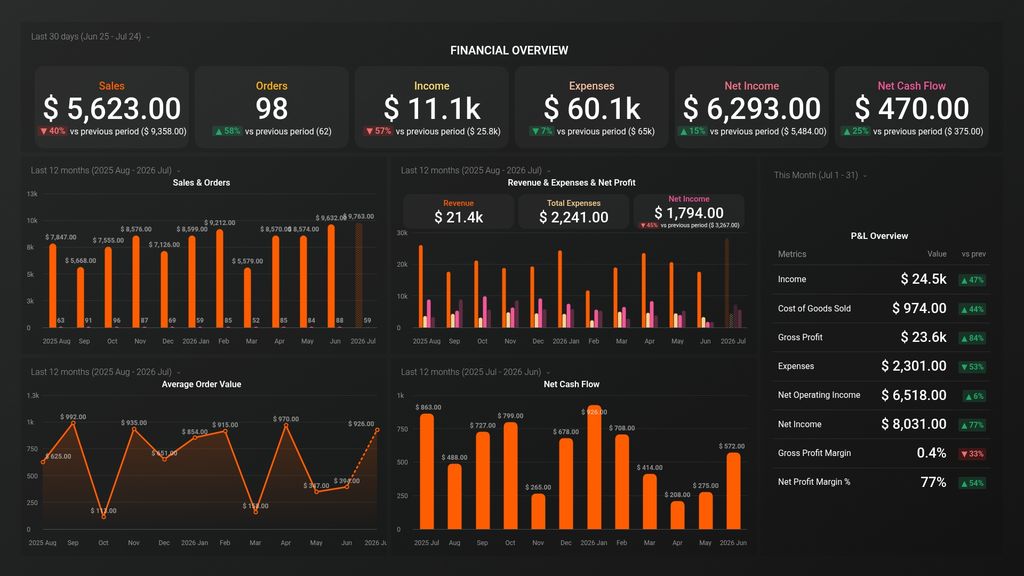
BigCommerce metrics included in this template
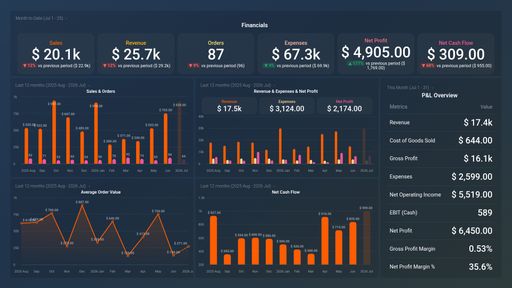
- Average Order Value