Uses one-click integrations:
-
 Pipedrive CRM
If you don't use Pipedrive CRM, you can pull data from any of our 130+ one-click, native integrations or from spreadsheets, databases and other APIs.
Try this dashboard for freeWhat you’ll learn from this Pipedrive CRM Account Overview Dashboard Template:
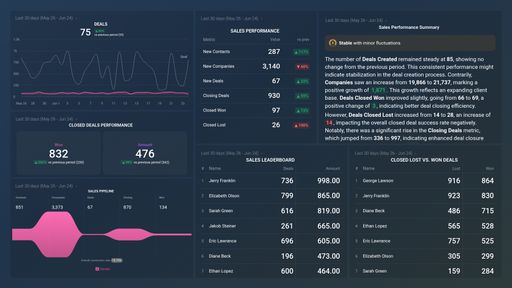
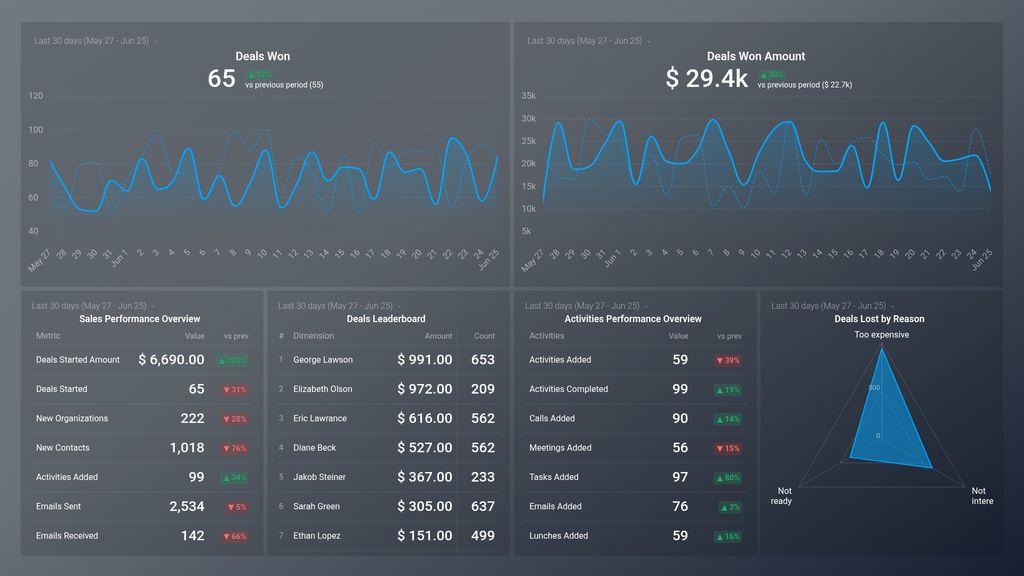
Use this Pipedrive CRM dashboard to get an instant snapshot of all opportunities, lost, won deals, and your team’s progress towards your set monthly sales goals. Connect your Pipedrive CRM account and learn:
- What’s the value of all won deals? Find out how much your won deals are worth in total at any given time. Compare the monetary value of all won deals for the current period to previous time periods.
- How many deals have my sales team closed this month? See how many deals your sales team closed within a certain period of time. By tracking the number of deals your sales reps close daily, you’ll be able to know if your team members are on track to meet their sales quotas and/or if changes or improvements are needed to optimize your sales process and to keep your sales pipeline healthy.
- How do I monitor sales performance? Get a comprehensive overview of your sales pipeline data at any given time. By tracking your most important sales pipeline KPIs, such as deals started, new organizations, new contacts, activities added, emails sent and received, you’ll be able to identify improvement opportunities quickly.
- Who is my best performing sales rep? See how many deals were handled by your sales representatives and the total value of deals won by each sales team member. Use this information to determine your high performers based on the number of activities and won deals.
- How do I monitor sales activities carried out by team members daily? Conveniently track and monitor key sales activities, including contacts, meetings, opportunities, and more at any given time.
- What are the most common reasons for lost deals? View the total number of lost opportunities and the reason(s) for these missed opportunities. Use this information to improve and change your sales strategy, especially if this is repeatedly stated as the reason why your leads keep opting out from purchasing your product or service.
Pull additional data using our deep integration with Pipedrive CRM
What else can you track and visualize with our deep integration with Pipedrive CRM? When it comes to leads, sales & revenue, almost anything:
-
- Sales pipeline and leaderboards
- Calls and meetings booked
- Sales cycle duration
- Deals by stage
- Closed Won (and lost) deals
- Sales activity by sales rep and more.
There are many, many different metrics and metric combinations you can track using Pipedrive CRM. And in Databox, you can quickly visualize dozens of sales metrics in a variety of different ways, alongside all the important metrics from other data sources you’re using.
Read more about Databox’s Pipedrive CRM integration.
Explore more Pipedrive dashboards.
Pipedrive CRM metrics included in this template
-
New Contacts
The New Contacts metric in Pipedrive measures the number of new leads or potential customers added to the system during a specific time period.
-
Lunches Added
The Lunches Added metric in Pipedrive reflects the number of new lunches that have been created within a specific time period, providing insights into the productivity of your sales or customer relationship team.
-
New Organizations
New Organizations metric measures the number of newly added organizations in Pipedrive CRM within a specific time period, typically a month or a quarter.