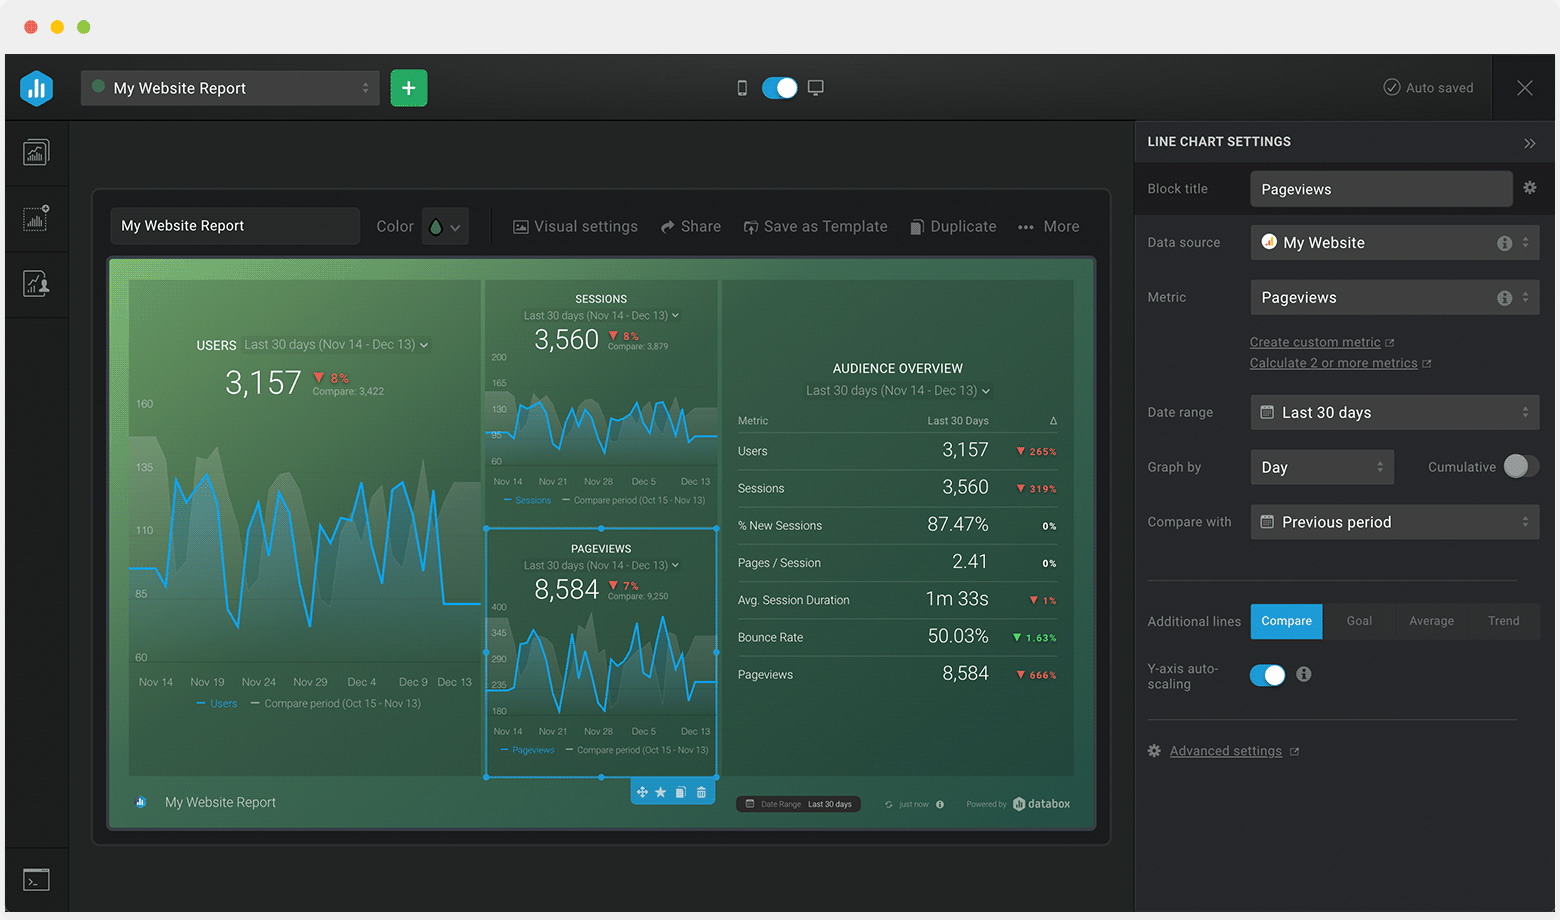
Track some of the most common Sales Pipeline metrics and KPIs and analyze your Sales Pipeline performance with just a few clicks.
You can build a dashboard with any data using Zapier, Make, Google Sheets, or a SQL database.

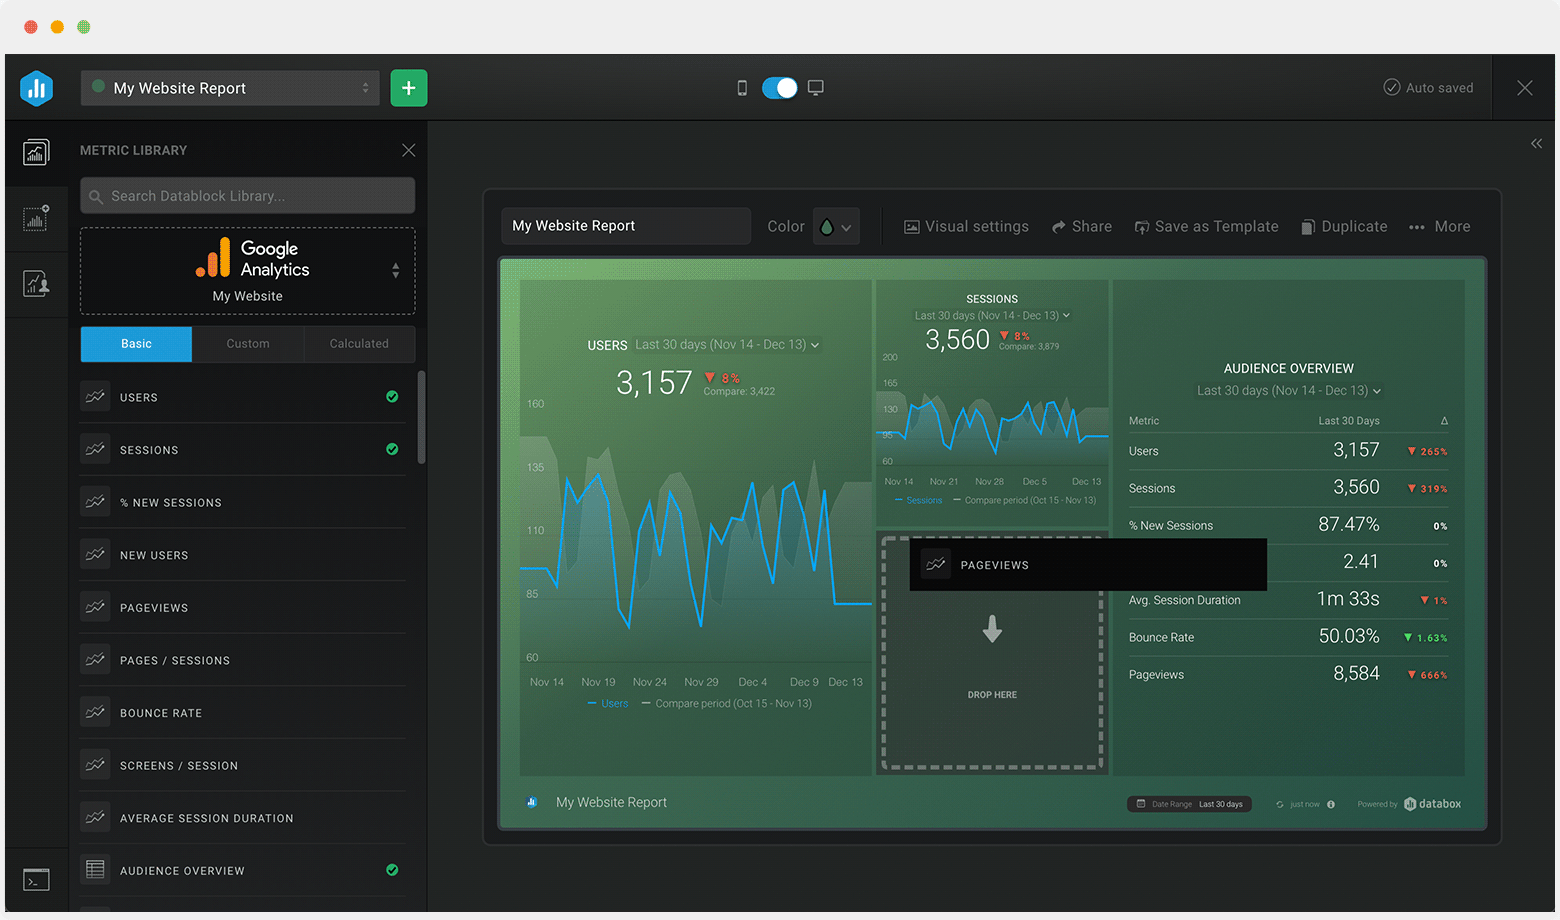
These sales pipeline dashboards come pre-built with some of the most commonly tracked sales KPIs and metrics from the most popular tools. You can also customize your templates later. To get started, just choose a template, connect your data, and your metric visualizations will populate automatically.
Try It Free


No design or coding skills necessary.
Learn more about Dashboard DesignerSales pipeline dashboards are an easy-to-read visual representation of a company’s sales pipeline. They help you to monitor and manage your sales prospects as they move through the different stages of the buyer’s cycle.
This makes it relatively easy to measure the effectiveness of your landing pages and CTAs, forecast sales and revenue more accurately, and spot exactly where your potential buyers are dropping off or getting stuck.
When building a sales pipeline dashboard, it is important to select the right sales metrics and KPIs. This will in turn, allow you to quickly identify what’s working and what isn’t and how to improve your strategy and performance over time.
The most important sales pipeline metrics you should be tracking are:
