


Table of contents
According to Databox’s state of business reporting, finance is one of top 3 most monitored and reported operations. If you manage a small business, you know how hard it can be to keep track of your finances. You only have so many resources to dedicate to your financial reporting, so you want to make them count.
More than half of the small business professionals we surveyed about their financial habits told us they use just one financial report.

So, when you need to optimize financial reporting for your small business, what reports should you prioritize? We surveyed almost 50 SMB professionals about their experiences to provide insight.

Let’s dive into what these experts had to say.
How to Manage Your Financial Reports
Your financial reporting workflow matters as much as the types of reports you use. When you have the right processes in place, it’ll become faster and easier to check your organization’s overall health. This point is especially critical when so many SMB owners and managers handle so many roles — including finance management.
After all, nearly 80% of the SMB professionals we surveyed stated their organization’s owners or managers review their financial reports.

What report format will help you optimize your workflow? Our respondents had two favorites — interactive financial dashboards and static reports.

Interactive dashboards built in financial reporting software, like Databox, help SMB professionals grow their financial performance through data visibility. The team at Austin and Kat used Databox’s dashboards to monitor their finances and adjust as needed.
Raven Beale, Austin and Kat’s finance director, told us, “We use Databox to get numbers in front of people. We want to be a data-driven company. Even in the short time we’ve been using it, just having things like our revenue lines versus goal front and center for people to be able to see allows us to be able to say we’re on track for DTC, we’re not on track for DTC.”
Beale also explained, “The main thing is you’ve got a central nervous system in the business. As small businesses, it’s tough to get those put in place, whereas a small business dashboard software like Databox allows us to provide those.”
Thanks to Databox’s interactive dashboards, Austin and Kat grew their net sales by 21% and saved 10 to 15 hours a week on reporting.
Of course, if you don’t have the resources to invest in an interactive small business dashboard, you can always start with static reports in your favorite spreadsheet software. Programs like Google Sheets and Microsoft Excel make a great starting point. Once you can afford an interactive business dashboard software, you’ll have your data on hand to transfer.
9 Must-Have Small Business Financial Reports
We asked survey respondents to choose their most important financial report from a list and tell us their top report type. Out of the reports we asked them to vote on, cash flow statements, balance sheets, and income statements received the most support.

When we prompted the SMB professionals to tell us about their top report types, they named 9 total reports:
- Income/Profit and Loss Statement
- Net Profit Margin Report
- Balance Sheet Report
- Cash Flow Statement
- Budget vs. Actual Report
- 13-Week Cash Forecast Report
- Weekly Sales Report
- Accounts Payable Aging Report
- Accounts Receivable
1. Income/Profit and Loss Statement
Whether you call it an income statement or profit and loss statement, this report will provide a broad look at your organization’s financial health.
“If I had to choose one financial report as the most important, I would choose the Income Statement, as it tells you if your business is operating at a profit or loss. No business can survive long term without profit,” says Melissa Houston, CPA. “You also base your operating budget on the income statement. Every business, regardless of size, should be using a budget.”
What is an income statement? According to Tim Davidson from Car Title Loan Defenders, it’s “responsible for measuring the expenses and revenues of the company over a period of time.”
Davidson continues, “This financial statement is very important for a small business because it assists in making the right decisions. For example, an income statement allows businesses to examine their company’s past financial results. A business owner will be able to make better financial decisions if they have access to data, such as the sales revenue, profits figures, and operating and non-operating margins. With accurate data, a business owner can make quick and smart decisions for the future.”
As Davidson points out, income statements are also crucial for tax purposes. “Income statements and other financial documents are extremely useful in determining a company’s tax responsibilities. Income statements that are correct and up to date provide a business owner with all of the information needed to compute various taxes,” Davidson explains.
“Profit/loss is significant since it indicates how profitable the company is as a whole,” adds Bradley Bonnen of iFlooded Restoration. “Revenue, or the income gained for services done or goods sold during that period of time, and expenses, or the costs incurred during that time period, are the two types of items on the income statement. Profit/loss, often known as net income/net loss, is calculated by subtracting expenses from revenue.”
You can track your profits and losses in Databox using the Quickbooks: Profit and Loss Overview Template. It automatically pulls data from Quickbooks so you can make more informed decisions in less time. Check out more profit and loss dashboard examples here.

2. Net Profit Margin Report
If you’re looking for a more granular analysis of your profits than an income and loss statement, you might prefer a net profit margin statement. Net profit margins — one of the most important small business performance metrics — are the profit you make in comparison to your total revenue. They give you perspective on your current profits compared to your past profits.
“The net profit margin is the most important financial report a business should have,” Aimvein’s Austin Dowse says. “Net profit margin shows how well the company did in comparison with their operating revenue. This ratio not only tells whether or not the company’s revenue is above or below that of their expenses but also reveals how efficiently money was spent during operations.”
Dowse stresses the importance behind the context you get from net profit margins. “It provides insight into the relationship between sales revenue and expenses. Simply put, it reflects how much money the business makes after paying all expenses and taxes. It compares gross income to net earnings. Without looking at a company’s net profit margin, it makes it difficult to truly assess how efficiently that company is operating and whether or not expenses are being managed properly,” Dowse explains. With the help of an expenses dashboard, you’ll always be in the know of whether (or not) you’re over spending or underspending.
Jane Anders from Cream Chargers explains how net profit margins work in action. “For example, if a company’s costs exceed its revenue, this is a key indicator of a negative financial situation. The owners will have to either put money into the business or find other short and long-term funding options. On the other hand, if a company is able to enhance sales while still breaking even and beginning to make a profit, it is demonstrating good performance,” Anders tells us.
Pro Tip: How to Stay on Top of the Financial Health of Your Business
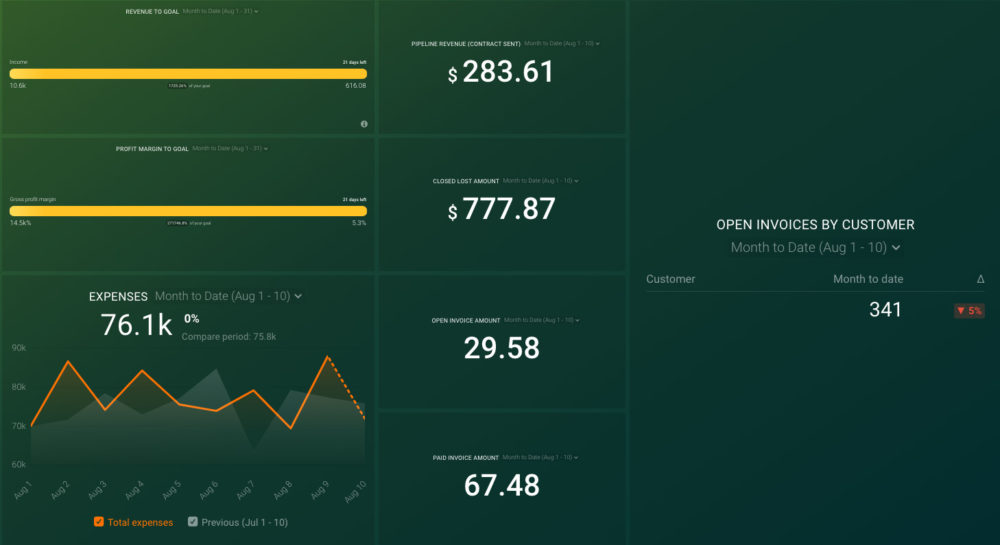
Do you own and manage a small business? Then you know how much of a struggle it can be to stay on top of the financial health of your business on a daily basis. Now you can pull data from QuickBooks and HubSpot’s CRM to track your key business metrics in one convenient dashboard, including:
- Open deals and deal amounts by pipeline stage. Get sales data directly from your HubSpot CRM and track deals, deal amounts, deal stages, and dates from your sales pipeline.
- Key financial data. Track gross profit margin, open invoices by amount and by customer, paid invoices, expenses, and income from QuickBooks.
Now you can benefit from the experience of our HubSpot CRM and QuickBooks experts, who have put together a plug-and-play Databox template that helps you monitor and analyze your key financial metrics. It’s simple to implement and start using it now!
You can easily set it up in just a few clicks – no coding required.
To set up the dashboard, follow these 3 simple steps:
Step 1: Get the template
Step 2: Connect your HubSpot and Quickbooks accounts with Databox.
Step 3: Watch your dashboard populate in seconds.
3. Balance Sheet
A large number of folks who took part in our survey named the balance sheet as their top financial report. And for good reason — it offers a full perspective on your assets and liabilities.
“As a rapidly expanding construction business, the Balance Sheet is our single most critical financial report,” explains Craig Ricks Jr. of Acadian Windows. “In real terms, this is what the business owns and owes at any given time. We rely on it to assess business performance, so its key to checking on how our resources are being put to use.”
David Aylor from David Aylor Law Offices agrees, adding, “Every small business owner should be looking at their balance sheet. This basic financial statement is a snapshot of the total assets, liabilities, and equity of a small business at any given time. It’s helpful to check the balance sheet quarterly to watch for trends and make better financial decisions for your business that takes your current financial state into account.”
Your balance sheet will come in handy when you need to borrow money. “If you’re looking to increase your business with a small business loan, you’ll want to watch your balance sheet closely and start improving your creditworthiness by increasing your assets and equity and decreasing the money you owe,” Aylor advises.
“A small business, in my opinion, should always have a proper, well-managed balance sheet,” Kolfox’s Aqsa Tabassam affirms. “It will not only advise the company but also provide a comprehensive picture of the financial situation. Knowing your assets and liabilities can be quite important for a small firm that is trying to thrive in a very competitive industry.”
Tabassam knows this from experience. “A balance sheet helped us to assess our company’s equity and offered us a clear picture of how to manage our cash flow for future investments etc. It enabled us to compute the assets and liabilities ratio, which showed how much we had earned and how much we owed. We will know when and how to raise funds to pay off the liabilities as a result of this,” they recount.
4. Cash Flow Statement
Our respondents named the cash flow statement as their most important report both in our poll and when prompted to name their own. This report tracks where your money is coming and going so you can keep your profits coming in steadily.
“It doesn’t matter how successful you are – if your cash flow isn’t solid and money is taking too long to roll in, your business can easily become insolvent and go under,” says John Li of Fig Loans. Li advises, “Monitor your cash flow reports closely and often, so you can see which areas of your business are thriving and which are in desperate need of an overhaul. Sometimes, this may mean making your accounts receivable deadlines shorter so you have cash coming in more regularly, or cutting down on expenses to keep cash from flowing out too far ahead of your returns.”
For YourParkingSpace’s Charles Cridland, a cash flow statement importance comes from its broad overview. “The cash flow statement is the most critical financial report because it’s vital in seeing the big picture. It summarizes all cash inflows and cash outflows of a business over a certain period, providing details where the money is spent and indicates if the business is generating enough cash or not. All businesses have fixed and variable costs paid from the money businesses generate, and the cash flow statement shows whether or not a company can do it,” Cridland states.
Cridland suggests reviewing your cash flow statement frequently, saying, “Many small businesses fail because of cash flow problems, so it’s important to regularly examine the cash flow statement to get a better perspective on the health of your business and make sure you stay on the positive side of that statistic. This document also helps in planning short-term and long-term investments. You can use it to estimate future cash flow, which will assist with budgeting and making better decisions about your business.”
Michele O’Connor from Fun In Key West counts on a cash flow report to stay on top of finances. “I use the cash flow report to determine not only how much cash is coming in but how much is going out. The [profit and loss statement] may show profitability, but cash flow shows what’s in hand and what is available for new projects or expansion. During the last year, I have had to adjust my monthly expenses to save on my cash position. The cash flow report became invaluable in showing where I can and should take those cuts,” O’Connor tells us.
If you need cash flow dashboards, you can browse through Databox free templates here.
5. Budget vs. Actual Report
It’s common to have a certain budget in mind while your actual spending follows a different pattern. A budget vs. actual report will help you stay on track.
What does this report cover? “As the name implies, the purpose of this report is to compare actual results, primarily from the income statement, to budgeted amounts expected at the start of the month,” says Brian Dean of Exploding Topics.
Dean continues, “The reader of this report will be able to determine how closely a company’s spending and income creation match the financial forecasting estimates mentioned in the budget. It can help identify over or under-budget regions, showing the ability to hire more staff or highlighting a gross profit margin that did not meet financial reporting standards. The budget vs. actual report should be generated regularly and compared to the financial statements to see if any areas of the business are falling short of expectations and need to be looked into further.”
According to Craig Campbell of Auto Parts Guideline, your budget vs. actual report’s usefulness will depend on your analysis. “The budget vs. actual financial report is a significant piece of information for the company, however, the actual power of this document lies in its analysis. The company can stay on course and produce more accurate plans for the future if it has a complete view of not only what happened to cause budget variances, but also why they happened.”
Campbell continues, “The goal of the analysis is to figure out ‘why’ each error and success occurs. This allows small businesses to calculate the ratio of failure and success. Finding differences is simple, but figuring out why they exist isn’t always so straightforward. When a form is able to understand the cause behind a failure they can make efforts to ensure that the same mistake isn’t repeated twice.”
6. 13-Week Cash Forecast
The reports covered so far look at previous financial patterns, but good financial habits also require good foresight. A 13-week (quarterly) cash forecast will help you understand what financial decisions you can make in the next few months.
“A 13-week cash forecast is the most important financial report a small business should look to when it is looking to ensure adequate working capital while aggressively hiring and scaling a business. Without this tool, it can be easy to grow too fast and find yourself underwater,” says Adam Rizzieri of Agency Partner Interactive.
7. Weekly Sales Report
If your business performs one-on-one sales, a weekly sales report can help you break those sales down by their financial impact.
“As a tech repair business based in Sydney, the number one financial report is our weekly sales report,” explains Felix Yim from Repair Circle. “This is where we review the jobs completed over the past 7 days, and we also include the costs of the jobs, which gives us our net profit of the business too. By looking at our numbers consistently, we can ensure our business is always in a financially healthy state.”
Sales reports come in all sorts of formats, so feel free to customize yours with the sales KPIs that matter to your business. They make a great touchpoint between your financial and sales departments.
You can use Databox to get a better understanding of your current sales pipeline. Download this free Sales Overview Dashboard to get a visual snapshot of your monthly sales performance, including a sales leaderboard, sales performance KPIs, productivity KPIs, progress towards previously set sales goals, and more. Browse more sales dashboards here.

8. Accounts Payable Aging Report
When you work with multiple vendors, accounts payable aging report will help you monitor the money you owe to them. This document will make it easier to maintain solid relationships with your vendors and stay on track with your bills.
Here’s how Joy Organics’ Gerrid Smith puts it: “Your [accounts payable] aging report tells you who you owe money to and how much you owe your vendors. You may quickly search up who you need to pay so you don’t miss the deadlines if your books are up to date. Late payments can damage relationships and result in late fees and other expenses.”
Long story short? “Simply pay on time. Some suppliers may even offer you a discount if you pay early. That’s a huge win-win situation!” Smith concludes.
Grab an accounts payable aging report template at My Excel Templates. It includes fields for past-due payments so you know which invoices to prioritize.
9. Accounts Receivable
While accounts payable reports track the money you owe to others, accounts receivable reports let you know who owes you money. They assist businesses with account-based sales.
According to Greg Rozdeba of Dundas Life, “The accounts receivable (AR) report provides a crucial snapshot of how quickly customers are paying their dues. These reports are mainly important because they aid in effective cash flow management.”
Rozdeba adds, “With such reports, you can identify customers who are consistently paying late, and those accounts that have become delinquent. You can use this information to determine when to stop offering your services/products so that you are not incurring further losses at the expense of such customers. AR reports are also important when it comes to effective payment collection management.”
Do you know how many paid invoices you have? Databox’s QuickBooks + HubSpot CRM: Financial Performance dashboard monitors your paid and open invoices to keep you on top of the payments owed to you. Browse more expenses dashboards here.


