
4.5 out of 5 stars

2024 High Performer on G2
4.8 out of 5 stars
The Only Small Business Dashboard Software That’s Free & Easy to Set Up
Databox is a custom dashboard software for small business that allows you to visualize, analyze, and report on business performance in one place.
Try it Free for 14 DaysBook a Demo


How to Build a Small Business Dashboard
Databox integrates with 75+ of the most popular software tools that companies use to track performance. We call these data sources. Connecting your first data source is easy––just choose the tool you’d like to pull data from, select the metrics you’d like to include in your dashboard, and you’re ready to visualize your data and customize as needed.
Drag & Drop metrics right into your dashboard and watch as they automatically populate with your data and chosen visualization type. Resize and rearrange your datablocks, add metrics from other data sources, and track all of your marketing metrics from any source in one place.

No more manual reporting. Once you build a dashboard, you can schedule automated snapshots of your dashboard to be emailed to members of your team on the day and time of your choosing, automate notifications in Slack, or simply grab a shareable link to share with your team.
Databox integrates with 75+ of the most popular software tools that companies use to track performance. We call these data sources. Connecting your first data source is easy––just choose the tool you’d like to pull data from, select the metrics you’d like to include in your dashboard, and you’re ready to visualize your data and customize as needed.
Drag & Drop metrics right into your dashboard and watch as they automatically populate with your data and chosen visualization type. Resize and rearrange your datablocks, add metrics from other data sources, and track all of your marketing metrics from any source in one place.
No more manual reporting. Once you build a dashboard, you can schedule automated snapshots of your dashboard to be emailed to members of your team on the day and time of your choosing, automate notifications in Slack, or simply grab a shareable link to share with your team.

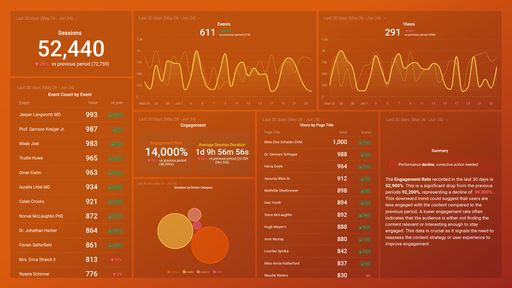
Get a Holistic View of How Your Small Business Is Doing
Office dashboard software has never been so comprehensive. Databox gives you the ability to see the most important KPIs for your company. See the peaks and valleys of your sales cycle, view the total number of customers or products sold, and your average churn rate. Get a quick breakdown of monthly recurring revenue and annual recurring revenue.
Try it Free for 14 Days
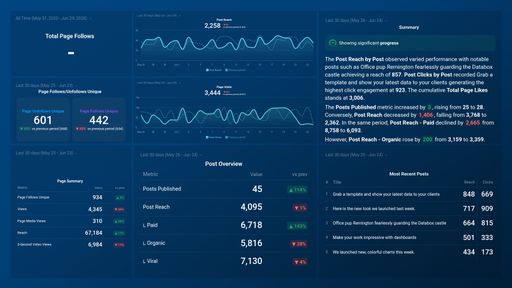
How Effective Is Your Website?
Track your site or online store performance to get a full understanding of what happens the moment someone visits your website. See the full customer journey from visitor to purchase and make iterative adjustments to your website to increase time spent on page, generate more leads, and reduce abandoned carts or forms. Find out which products or services are the most popular and spend more time perfecting what works.
Try it Free for 14 Days
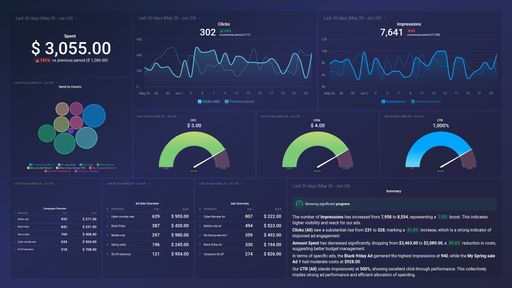
Track Your Marketing Efforts
Databox is a dashboard software for small business, which means you can connect all of your favorite marketing and business tools. Track affiliates or referrals to see the effectiveness of word-of-mouth and influencer marketing. Create a dashboard that captures an entire marketing funnel or drill down into specific campaigns so that you can adjust your budget. Watch your email list grow, or keep track of your content engine and find new ways to rank on Google.
Try it Free for 14 Days
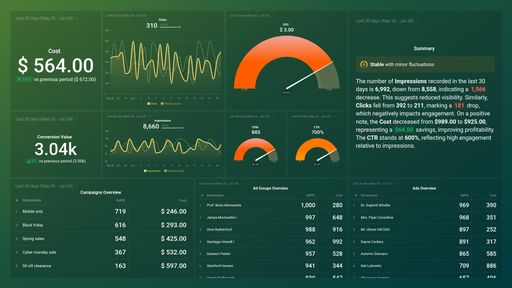
Stay On Top of Your Finances
Never search for the bottom line again. Get a summary of your business expenses and cash flow at a glance with a P&L dashboard. Easily view your open invoices and overdue invoices so that you know what’s owed, and never make financial guesstimates again.
Try it Free for 14 DaysWhat our customers say about us...
“It gives such a great view on what’s happening with your audience, how they react to things, what people do on your website. Looking at all this data in one place is great.”
Anastasia HamelMarketing Manager at Deeplite
“Before Databox, we had a whiteboard where we kept track of all of our KPIs. It used to take hours every week to update the data. We would have 10 to 12 hours per week assigned to update the whiteboards. We now do it in probably 10 or 12 minutes because of Databox.”
Mary WhiteVP of Operations at MarketLauncher

“Databox’s support team has been awesome. In some cases, they would create Databoards for me, and I would reverse engineer with what they did. One member of the team even hopped on an hour-long call with me, which made the transition easier.”
Robbie RichardsCEO & Founder at Virayo

Build Your Small Business Dashboard with Our Library of One-Click integrations
The easiest way to connect your data with Databox is through any of our 75+ one-click integrations.
Explore 75+ Dashboard Integrations
Use Thousands of Pre-Built Business Metrics or Create Your Own
Databox integrations come loaded with a library of thousands of pre-built metrics––this means all you have to do is drag-and-drop them into your dashboard and your data and chosen visualization type will populate automatically.. Take it step further by creating custom calculations that give you even more information about the data you’re tracking.
Open Invoices Amount
Total amount of Open Invoices.
Expenses
The amount of Expenses (the difference between Income and Net Income) during the specified Date Range.
Orders
Number of Orders that were placed during the specified Date Range.
Revenue by Landing Page
Revenue from Web Ecommerce or In-app Transactions during the specified Date Range split up by Landing Page.
Sessions
Number of Sessions during specified Date Range. A session is the period time a user is actively engaged with your website, app, etc.
Bounce Rate
Percentage of Single-Page Sessions in which there was no Interaction with the Page during specified Date Range. A bounced Session has a duration of 0 seconds.
Explore Hundreds of Pre-Built Small Business Dashboard Templates
With 200+ pre-built dashboard templates that can be setup in minutes, we’ve got you covered. Track your company’s performance from finances to marketing from tools like Quickbooks, Stripe, Google Analytics, Facebook Ads, and many more. Download the free template, connect your data sources, and get instant visualizations of your key business metrics in minutes.
What Else Can You Do With Databox?
Make your performance more predictable with Databox’s array of top-tier features that help small business owners and teams build dashboards, track performance, and report results with ease.

Dashboard Designer
No more fumbling around trying to visualize data in spreadsheets or slides. With our DIY Dashboard Designer, anyone can pull the metrics they need, visualize KPIs in a variety of ways, and build meaningful dashboards–no code or design skills necessary.

Calculated Metrics
With Data Calculations, you can combine data from multiple sources and easily calculate new metrics, KPIs, conversion rates, ROI, and much more — all without coding or spreadsheets.

Goal Tracker
Goals aren’t hit in a spreadsheet. With Databox, you can visualize your goals against current performance so you can make adjustments when they matter most.

Looped Dashboards
With amazing reporting features like Looped Dashboards, you can connect multiple dashboard reports together in one centralized report and easily share it with others.

Custom Metric Builder
Sometimes the preconfigured metrics from the tools you use aren’t enough. Use dimensions and filters to build custom metrics that allow you to pull more granular performance insights. With Query Builder, anyone can build the specific metrics they need without any engineering work.

TV Dashboards
Whether you’re viewing performance from your desktop, phone, TV, or even your wrist – Databox makes your data accessible no matter where you’re viewing it.
Start Building Your Small Business Dashboard
No more logging into dozens of different tools to understand performance—now you and your team can easily connect your data, build and share reports, monitor trends, and discover insights.
Try it Free for 14 DaysFrequently Asked Questions
What is the best dashboard software?
Databox is an office dashboard software. With hundreds of one-click native integrations with the industry’s top social media platforms and marketing tech, it’s simple to connect your most-loved data sources to Databox and analyze your business performance.
Which businesses use dashboards?
A variety of business types, industries, and niches use office dashboard software. Databox is a dashboard software for small business, and a lot of magic happens when you connect all of your performance data in one place—with Databox, you can also set and measure progress toward goals, create custom metrics, share and automate reports with your team, get notifications when certain metrics are on or off track, and much more.
Do you offer special Agency features?
We do! Features for agencies include: client management, client performance monitoring, templated reports, annotation capabilities, and alerts & notifications. Find out more about agency features here.
What is the best dashboard builder?
Databox is a dashboard software for small business. With hundreds of one-click native integrations with the industry’s top social media platforms and marketing tech, it’s simple to connect your most-loved data sources to Databox.
What is the best KPI dashboard?
While many business tools include analytics features, Databox allows you to connect all of your favorite tools in one place, like Quickbooks, Mailchimp, Stripe, and Google Analytics. Find out more about our native and third party integrations.
Which small business data source integrations do you support?
We have 75+ one-click integrations, including: Google Analytics, Hubspot Marketing, Shopify, and Xero. Find out more about our native and third party integrations.
How do I build a business scorecard or report?
Databox Scorecards send you updates on your key performance indicators (KPIs) through email, mobile push notification, and/or Slack every day, week, or month. We also support scheduled Snapshots, embedding your databoards, Looped databoards, and offer white-labeling.

Clear answers,
as fast as you have questions.
Compare
Databox Inc.
HQ: Boston, MA, USA
AI-powered analytics for teams that need answers now.
Databox Inc.
HQ: Boston, MA, USA

AI-powered analytics for teams that need answers now.


Compare