
4.5 out of 5 star

2024 High Performer on G2
4.8 out of 5 stars
The Only Financial Dashboard Software That’s Free & Easy to Set Up
Databox is a custom finance dashboard software that allows you to visualize, analyze, and report on financial performance in one place.
Try it Free for 14 DaysBook a Demo


How to Build a Finance Dashboard
Databox integrates with 100+ of the most popular software tools that companies use to track performance. We call these data sources. Connecting your first data source is easy––just choose the tool you’d like to pull data from, select the metrics you’d like to include in your dashboard, and you’re ready to visualize your data and customize as needed.
Drag & Drop metrics right into your dashboard and watch as they automatically populate with your data and chosen visualization type. Resize and rearrange your datablocks, add metrics from other data sources, and track all of your marketing metrics from any source in one place.

No more manual reporting. Once you build a dashboard, you can schedule automated snapshots of your dashboard to be emailed to members of your team on the day and time of your choosing, automate notifications in Slack, or simply grab a shareable link to share with your team.
Databox integrates with 100+ of the most popular software tools that companies use to track performance. We call these data sources. Connecting your first data source is easy––just choose the tool you’d like to pull data from, select the metrics you’d like to include in your dashboard, and you’re ready to visualize your data and customize as needed.
Drag & Drop metrics right into your dashboard and watch as they automatically populate with your data and chosen visualization type. Resize and rearrange your datablocks, add metrics from other data sources, and track all of your marketing metrics from any source in one place.
No more manual reporting. Once you build a dashboard, you can schedule automated snapshots of your dashboard to be emailed to members of your team on the day and time of your choosing, automate notifications in Slack, or simply grab a shareable link to share with your team.

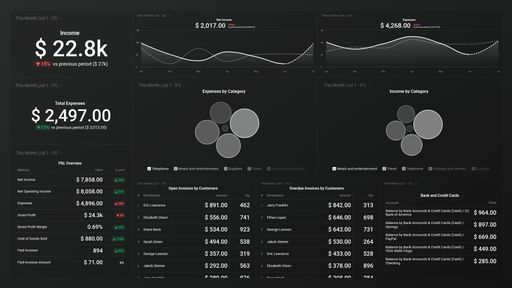
Get a Holistic View of Your Company’s Finances
Never search for the bottom line again. Get a summary of your business expenses and cash flow at a glance with a high-level financial dashboard. Easily view your open invoices and overdue invoices so that you know what’s owed, revenue generated and forecasted so you know what’s coming in, and never make financial guesstimates again.
Try it Free for 14 Days
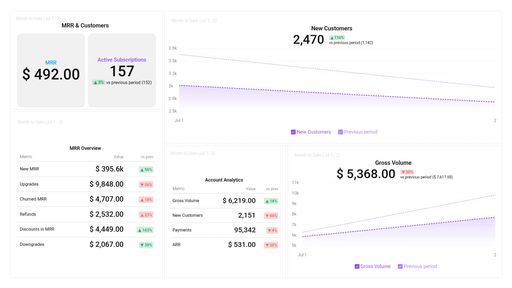
Connect Everything in One Place
Connecting data from your sales, marketing, and bookkeeping tools all in one place is finally possible with Databox. View the most important financial KPIs for your company and how they relate to the goals your marketing and sales teams are actively working towards. See the peaks and valleys of your sales cycle, view the total number of customers or products sold, and your average churn rate. Get a quick breakdown of monthly recurring revenue and annual recurring revenue.
Try it Free for 14 Days
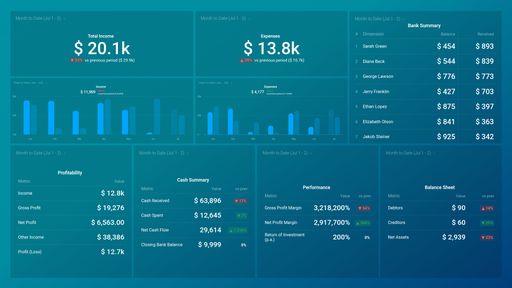
Make Data-Backed Budgeting Decisions
Ban the hunches for good. With access to so much data, your operations and executive teams can make more informed budgeting and investment decisions. Should you hire more salespeople, spend more on marketing to improve the productivity of your existing sales team, or develop that new service to increase the spend of your existing clients? With Databox financial dashboards, make these decisions with confidence as you look at historical trends, see how you’re performing right now, and forecast key performance indicators into the future.
Try it Free for 14 Days
Relevant Reports in Less Time
Even with the right bookkeeping tech, going back and forth between your payment processor, sales pipeline tools, and spreadsheet formulas can make understanding your financial status difficult—especially when it becomes outdated in days, or even hours. Databox syncs directly with your tools, and your financial dashboard can be shared easily with a link, meaning every report you send is accurate and up-to-date no matter when it’s viewed. Loop specific dashboards together for an even more comprehensive report, and schedule a one-time or recurring send in Slack or via email so you can cross reporting off your to-do list for good.
Try it Free for 14 DaysWhat our customers say about us...
“Ever since I’ve worked with Databox and I’ve fallen in love more and more. It’s the easiness of user interface, the ability to create custom metrics, and add various sources.”
Anastasia HamelMarketing Manager at Deeplite

“If you can’t make sense of what’s happening in the software you’re using, use Databox and figure it out.”
Bryan GormanGrowth Strategist at Nextiny

“The templates are almost like a crowdsourced library, where you can pick and choose from what other people have done in the past. They have been awesome because sometimes it’s hard to know where to start. The ability to filter templates makes it easy to draw inspiration and clone Databoards.”
Robbie RichardsCEO & Founder at Virayo

Build Your Financial Dashboard with Our Library of One-Click integrations
The easiest way to connect your data with Databox is through any of our 100+ one-click integrations.
Explore 100+ Dashboard Integrations
Use Thousands of Pre-Built Financial Metrics or Create Your Own
Databox integrations come loaded with a library of thousands of pre-built metrics––this means all you have to do is drag-and-drop them into your dashboard and your data and chosen visualization type will populate automatically.. Take it step further by creating custom calculations that give you even more information about the data you’re tracking.
Total Income
Total Income during the specified Date Range (Profit & Loss Report). Daily totals are not available for this metric. Instead, the total current value of this metric will be visualized cumulatively.
Gross Profit (Budget)
Gross Profit Budget during the specified Date Range (Budget Summary Report). Daily totals are not available for this metric. Instead, the total current value of this metric will be visualized cumulatively.
Invoices Issued
Total number of Issued Invoices during the specified Date Range.
Outstanding Payments by Contact
Outstanding Payments during the specified Date Range split up by Contact Name. Daily totals are not available for this metric. Instead, the total current value of this metric will be visualized cumulatively. No historical data is available from before initial connection.
Expenses
Expenses during the specified Date Range (Executive Summary Report). Daily totals are not available for this metric. Instead, the total current value of this metric will be visualized cumulatively.
Short Term Cash Forecast
Short term cash forecast during the specified date range (Executive Summary Report). Daily totals are not available for this metric. Instead, the total current value of this metric will be visualized cumulatively.
Explore All of Our of Pre-Built Finance Dashboard Templates
With 10+ pre-built dashboard templates that can be setup in minutes, we’ve got you covered. Track your financial performance from tools like Quickbooks, Xero, Stripe, PayPal, and more. Download the free template, connect your data sources, and get instant visualizations of your key finance metrics in minutes.
What Else Can You Do With Databox?
Make your performance more predictable with Databox’s array of top-tier features that help admin, ops, and accounting teams build dashboards, track performance, and report results with ease.

Dashboard Designer
No more fumbling around trying to visualize data in spreadsheets or slides. With our DIY Dashboard Designer, anyone can pull the metrics they need, visualize KPIs in a variety of ways, and build meaningful dashboards–no code or design skills necessary.

Calculated Metrics
With Data Calculations, you can combine data from multiple sources and easily calculate new metrics, KPIs, conversion rates, ROI, and much more — all without coding or spreadsheets.

Goal Tracker
Goals aren’t hit in a spreadsheet. With Databox, you can visualize your goals against current performance so you can make adjustments when they matter most.

Looped Dashboards
With amazing reporting features like Looped Dashboards, you can connect multiple dashboard reports together in one centralized report and easily share it with others.

Custom Metric Builder
Sometimes the preconfigured metrics from the tools you use aren’t enough. Use dimensions and filters to build custom metrics that allow you to pull more granular performance insights. With Query Builder, anyone can build the specific metrics they need without any engineering work.

TV Dashboards
Whether you’re viewing performance from your desktop, phone, TV, or even your wrist – Databox makes your data accessible no matter where you’re viewing it.
Start Building Your Finance Dashboard
No more logging into dozens of different tools to understand performance — now you and your team can easily connect your data, build and share reports, monitor trends, and discover insights.
Try it Free for 14 DaysFrequently Asked Questions
What is the best software for dashboards?
Databox is a finance dashboard software. With hundreds of one-click native integrations with the industry’s top bookkeeping, accounting, and payment platforms, it’s simple to connect your most-critical data sources to Databox.
Which finance data source integrations do you support?
We have 100+ one-click integrations, including: Profitwell, Stripe, Xero, and Quickbooks. Find out more about our native and third party integrations.
How do I create a finance dashboard?
To connect your first integration in Databox, find it in Data Sources, then just log in to connect. Drag & Drop metrics right into your dashboard and watch as they automatically populate with your data and chosen visualization type. Resize and rearrange your datablocks, add metrics from other data sources, and track all of your marketing metrics from any source in one place.
What is a financial dashboard?
A financial dashboard helps you track finance metrics, KPIs, and report on progress towards set goals. You can track just about anything using a great finance dashboard software like Databox, including:
- Profit and loss performance
- Revenue and customer growth
- Expenses, invoices, and profitablility
- Cash flow
Want a head start? Databox has 10+ financial dashboard examples and templates that come pre-built with some of the most commonly tracked metrics from the most popular tools. Customize your templates at any time. Check them out and create your Databox account to get started.
How do I build a financial scorecard or report?
Databox Scorecards send you updates on your key performance indicators (KPIs) through email, mobile push notification, and/or Slack every day, week, or month. We also support scheduled Snapshots, embedding your databoards, Looped databoards, and offer white-labeling.
Do you offer special Agency features?
We do! Features for agencies include: client management, client performance monitoring, templated reports, annotation capabilities, and alerts & notifications. Find out more about agency features here.

Clear answers,
as fast as you have questions.
Compare
Databox Inc.
HQ: Boston, MA, USA
AI-powered analytics for teams that need answers now.
Databox Inc.
HQ: Boston, MA, USA

AI-powered analytics for teams that need answers now.


Compare