
4.5 out of 5 stars

2024 High Performer on G2
4.8 out of 5 stars
The Only Project Management Dashboard Software That’s Free & Easy to Set Up
Databox is a custom project management dashboard software that allows you to visualize, analyze, and report on performance in one place.
Try it Free for 14 DaysBook a Demo


How to Build a Project Management Dashboard
Databox integrates with 100+ of the most popular software tools that companies use to track performance. We call these data sources. Connecting your first data source is easy––just choose the tool you’d like to pull data from, select the metrics you’d like to include in your dashboard, and you’re ready to visualize your data and customize as needed.
Drag & Drop metrics right into your dashboard and watch as they automatically populate with your data and chosen visualization type. Resize and rearrange your datablocks, add metrics from other data sources, and track all of your marketing metrics from any source in one place.

No more manual reporting. Once you build a dashboard, you can schedule automated snapshots of your dashboard to be emailed to members of your team on the day and time of your choosing, automate notifications in Slack, or simply grab a shareable link to share with your team.
Databox integrates with 100+ of the most popular software tools that companies use to track performance. We call these data sources. Connecting your first data source is easy––just choose the tool you’d like to pull data from, select the metrics you’d like to include in your dashboard, and you’re ready to visualize your data and customize as needed.
Drag & Drop metrics right into your dashboard and watch as they automatically populate with your data and chosen visualization type. Resize and rearrange your datablocks, add metrics from other data sources, and track all of your marketing metrics from any source in one place.
No more manual reporting. Once you build a dashboard, you can schedule automated snapshots of your dashboard to be emailed to members of your team on the day and time of your choosing, automate notifications in Slack, or simply grab a shareable link to share with your team.

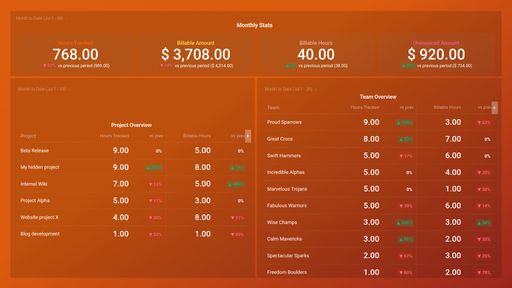
Get a High-Level View of Your Projects
Get the data you need at-a-glance with connecting your project management software with our high-level project management dashboard. Whether you are time-tracking employees and contractors, working on client projects, resolving issues or managing a team that’s spinning a lot of plates, Databox is a free project management dashboard software that can help you get up-to-date progress and completion metrics from your project management tools.
Try it Free for 14 Days
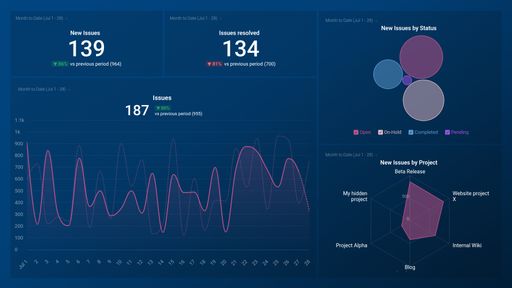
Dig Deeper into Your Team’s Activities
Track your team’s progress and compare to previous periods to see cumulative growth. View side-by-side individual performance and adjust workloads, reprioritize tasks, or alter processes for maximum effectiveness. Review project data with your team during daily standups or scrum to create a plan of attack on the projects that matter most.
Try it Free for 14 Days
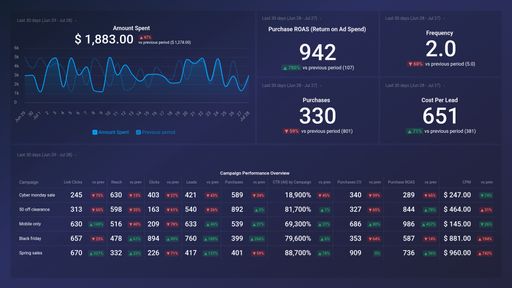
Customized Reporting for Every Team
Different project teams are unique—screenshots, shared spreadsheets, or one-and-done slide deck reports simply can’t capture actionable data for every single team. With Databox, you can create and send customized reports specific to each teams’ needs based on their project planning. Loop specific dashboards together and schedule a one-time or recurring send in Slack or via email.
Try it Free for 14 Days
Align Up & Across Departments
Don’t make your colleagues or high-level managers wade through defunct project tracking boards or decipher your team’s technological shorthand to check in on progress or get estimated completion dates. Databox makes it easy to create super-digestible project management dashboards that you can Snapshot and share with a simple link.
Try it Free for 14 DaysWhat our customers say about us...
“As a manager, it really helps me track the team’s progress. It helps track performance. I keep an eye on the boards daily to make sure the team is on track with both. It allows me to see the monthly goals, our progress toward them in real-time, and where they need to be.” –
Terri-Lynn AndersonSales Manager at MarketLauncher
“It’s improved how we can spot and jump on some work. It’s essential that we can get a plan of action in place and make sure we’re all aligned—especially now with remote work. Without those Scorecards in place, it would be a bit of a nightmare.”
Dan ThomasLead Strategist at Digital 22
“I share one snapshot to the whole team and I don’t need to update the dashboard. Whenever they look, it’s updated real-time data. That’s really important.”
Anastasia HamelMarketing Manager at Deeplite

Build Your Project Management Dashboard with Our Library of One-Click integrations
The easiest way to connect your data with Databox is through any of our 100+ one-click integrations.
Explore 100+ Dashboard Integrations
Use Thousands of Pre-Built Metrics or Create Your Own
Databox integrations come loaded with a library of thousands of pre-built metrics––this means all you have to do is drag-and-drop them into your dashboard and your data and chosen visualization type will populate automatically.. Take it step further by creating custom calculations that highlight project status or give you even more information about the data you’re tracking.
Active New Projects
Total number of Active Projects. Daily totals are not available for this metric. The total current value of this metric will be visualized cumulatively.
New Tasks
Number of New Tasks created during the specified Date Range.
Tasks Completed
Number of Completed Tasks during the specified Date Range.
Tasks Completed by Project
Number of Completed Tasks during the specified Date Range split up by Project.
Tasks Overdue
Total number of Overdue Tasks. The total current value of this metric will be visualized cumulatively.
Hours Tracked by Project
Number of Hours Tracked during the specified Date Range split up by Projects.
Explore Our Pre-Built Top Project Management Dashboard Examples with Templates
With pre-built dashboard templates that can be setup in minutes, we’ve got you covered. Perfect to pair with your favorite project management solution. Track your team’s performance from tools like Harvest, Jira, and Teamwork. Download the free template, connect your data sources, and get instant visualizations of your key project metrics in minutes.
What Else Can You Do With Databox?
Make your performance more predictable with Databox’s array of top-tier features that help project managers and teams build dashboards, track performance, and report results with ease.

Dashboard Designer
No more fumbling around trying to visualize data in spreadsheets or slides. With our DIY Dashboard Designer, anyone can pull the metrics they need, visualize KPIs in a variety of ways, and build meaningful dashboards–no code or design skills necessary.

Calculated Metrics
With Data Calculations, you can combine data from multiple sources and easily calculate new metrics, KPIs, conversion rates, ROI, and much more — all without coding or spreadsheets.

Goal Tracker
Goals aren’t hit in a spreadsheet. With Databox, you can visualize your goals against current performance so you can make adjustments when they matter most.

Looped Dashboards
With amazing reporting features like Looped Dashboards, you can connect multiple dashboard reports together in one centralized report and easily share it with others.

Custom Metric Builder
Sometimes the preconfigured metrics from the tools you use aren’t enough. Use dimensions and filters to build custom metrics that allow you to pull more granular performance insights. With Query Builder, anyone can build the specific metrics they need without any engineering work.

TV Dashboards
Whether you’re viewing performance from your desktop, phone, TV, or even your wrist – Databox makes your data accessible no matter where you’re viewing it.
Start Building Your Project Management Dashboard
No more logging into dozens of different tools missing key features to understand performance — now project managers and their teams can easily connect your data, build and share reports, monitor trends, and discover insights.
Try it Free for 14 DaysFrequently Asked Questions
Is Databox free to use?
Yes, Databox offers a free plan that allows you to create and manage social media dashboards with access to basic features. For more advanced functionalities, we offer various paid plans to suit your needs.
What is a dashboard for project management?
Databox is a project management dashboard software. With hundreds of one-click native integrations with the industry’s top tech solutions and platforms, it’s simple to connect your most-critical data sources to Databox.
Do you offer special Agency features?
We do! Features for agencies include: client management, client performance monitoring, templated reports, annotation capabilities, and alerts & notifications. Find out more about agency features here.
How secure is my data with Databox?
We prioritize the security of your data. Databox uses industry-standard encryption protocols to protect your information both in transit and at rest. Additionally, we comply with relevant data protection regulations to ensure your data remains safe and confidential.
How do I create a project management dashboard?
To connect your first integration in Databox, find it in Data Sources, then just log in to connect. Drag & Drop metrics right into your dashboard and watch as they automatically populate with your data and chosen visualization type. Resize and rearrange your datablocks, add metrics from other data sources, and track all of your marketing metrics from any source in one place.
Which project management data source integrations do you support?
We have 75+ one-click integrations, including: Teamwork, Jira, and Harvest.. Find out more about our native and third party integrations.
How do I build a project management scorecard or report?
Databox Scorecards send you updates on your key performance indicators (KPIs) through email, mobile push notification, and/or Slack every day, week, or month. We also support scheduled Snapshots, embedding your databoards, Looped databoards, and offer white-labeling.


GDPR
compliant
compliant
certified