4.5 out of 5 stars

2024 High Performer on G2
4.8 out of 5 stars
The Only Sales Dashboard Software That’s Free & Easy to Set Up
Databox is a custom sales dashboard software that allows you to visualize, analyze, and report on sales performance in one place.
Try it Free for 14 DaysBook a Demo


How to Build a Sales Dashboard
Databox integrates with 100+ of the most popular software tools that companies use to track performance. We call these data sources. Connecting your first data source is easy––just choose the tool you’d like to pull data from, select the metrics you’d like to include in your dashboard, and you’re ready to visualize your data and customize as needed.
Drag & Drop metrics right into your dashboard and watch as they automatically populate with your data and chosen visualization type. Resize and rearrange your datablocks, add metrics from other data sources, and track all of your marketing metrics from any source in one place.

No more manual reporting. Once you build a dashboard, you can schedule automated snapshots of your dashboard to be emailed to members of your team on the day and time of your choosing, automate notifications in Slack, or simply grab a shareable link to share with your team.
Databox integrates with 100+ of the most popular software tools that companies use to track performance. We call these data sources. Connecting your first data source is easy––just choose the tool you’d like to pull data from, select the metrics you’d like to include in your dashboard, and you’re ready to visualize your data and customize as needed.
Drag & Drop metrics right into your dashboard and watch as they automatically populate with your data and chosen visualization type. Resize and rearrange your datablocks, add metrics from other data sources, and track all of your marketing metrics from any source in one place.
No more manual reporting. Once you build a dashboard, you can schedule automated snapshots of your dashboard to be emailed to members of your team on the day and time of your choosing, automate notifications in Slack, or simply grab a shareable link to share with your team.

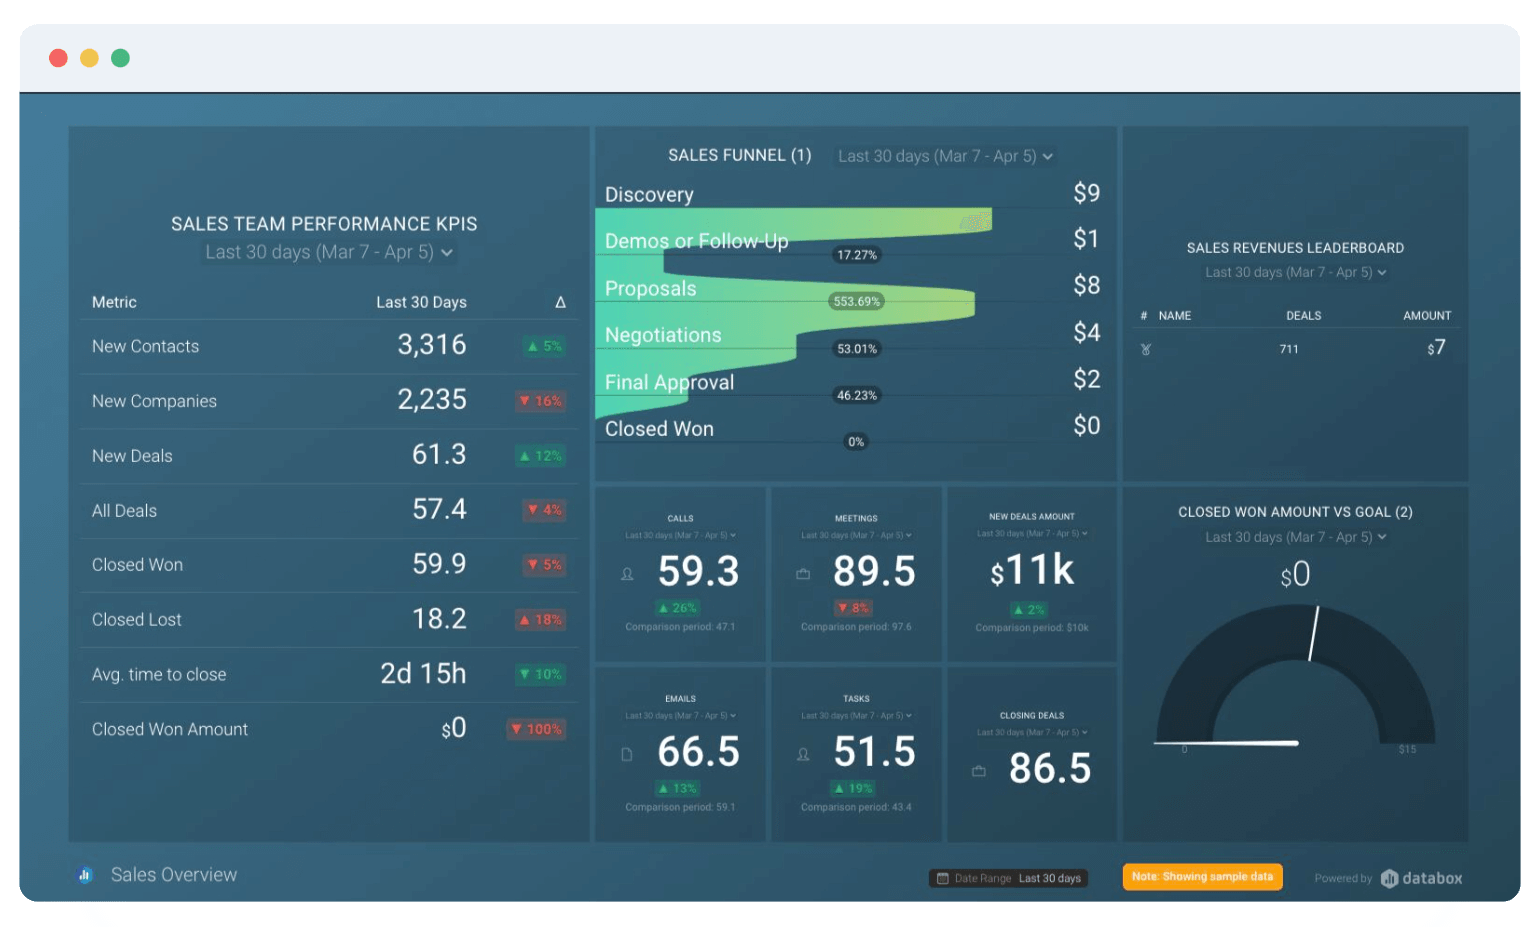
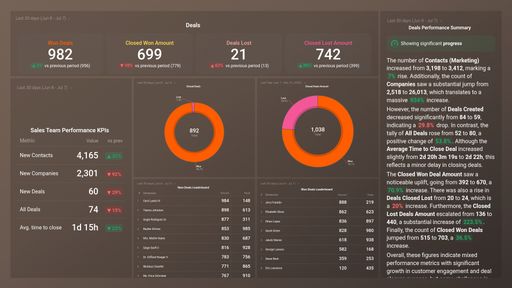
Get a High-Level View of Your Sales Pipeline
Get the data you need at-a-glance with a high-level sales dashboard. See how many leads (or dollars) are in your current pipeline, and get up-to-date sales performance metrics and KPIs like your average conversion rate and total amount of deals closed won. Easily see which activities are generating revenue, and how many open deals your team is working on.
Try it Free for 14 Days
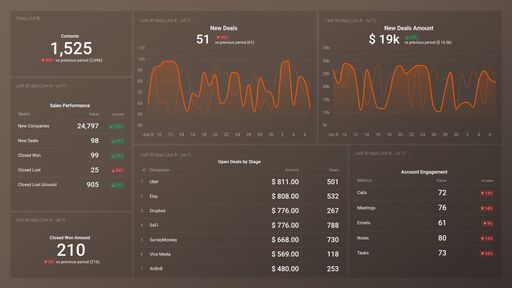
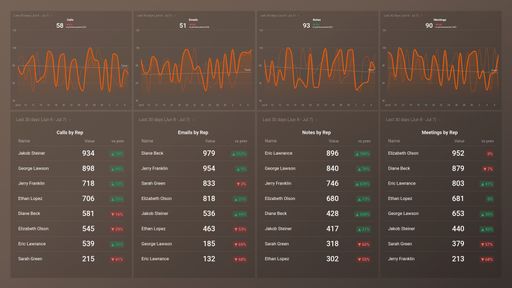
Dig Deeper Into Sales Activities
Track sales activities and touch points like calls, emails, tasks, and deadlines. Compare to previous periods to see cumulative growth. See side-by-side sales rep performance and adjust training or scripts as necessary for maximum growth. Get the entire team together to review data like Closed Lost by Reason to talk out objection strategies.
Try it Free for 14 Days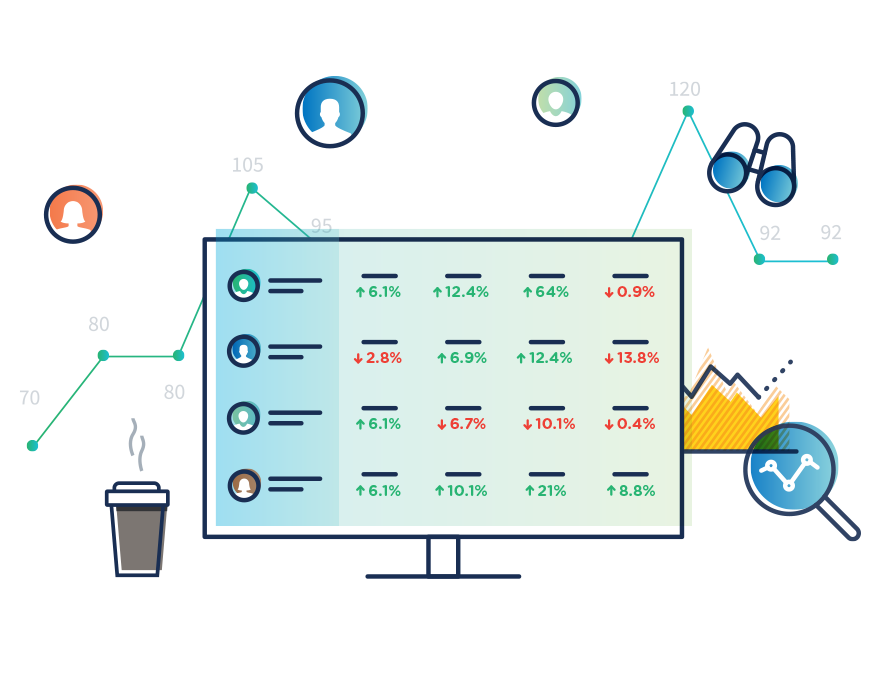
No More Dry Erase Leaderboards
Ditch the whiteboard and upgrade to a digital leaderboard. Makes your contests even more competitive—since Databox is a sales dashboard software that integrates with some of the most popular sales tools on the market, your reps can keep working out of your CRM and all of their wins will be reflected in your sales dashboard. See who’s conversion rate is raising the bar, who is closing the biggest deals, and who might need a little more guidance.
Try it Free for 14 Days
Track Individual Rep Performance
Set your managers up for success with the ability to track individual sales rep performance. Give each team member visibility into their owned KPIs, so they can easily see how they stack up against the team average. Give high-performing team members opportunities to share what they know, or reward your most consistent team members by comparing their KPIs with previous dates.
Try it Free for 14 DaysWhat our customers say about us...
“As a manager, it really helps me track the team’s progress. It helps track performance. I keep an eye on the boards daily to make sure the team is on track with both. It allows me to see the monthly goals, our progress toward them in real-time, and where they need to be.”
Terri-Lynn AndersonSales Manager at MarketLauncher
“Ever since I’ve worked with Databox and I’ve fallen in love more and more. It’s the easiness of user interface, the ability to create custom metrics, and add various sources.”
Anastasia HamelMarketing Manager for Deeplite
“Before Databox, we had a whiteboard where we kept track of all of our KPIs,” explains VP of Operations Mary White. “It used to take hours every week to update the data. We would have 10 to 12 hours per week assigned to update the whiteboards. We now do it in probably 10 or 12 minutes because of Databox.”
Paul SchmidtSmartBug Media

Build Your Sales Dashboard with Our Library of One-Click integrations
The easiest way to connect your data with Databox is through any of our 100+ one-click integrations.
Explore 100+ Dashboard Integrations
Use Thousands of Pre-Built Sales Metrics or Create Your Own
Databox integrations come loaded with a library of thousands of pre-built metrics––this means all you have to do is drag-and-drop them into your dashboard and your data and chosen visualization type will populate automatically.. Take it step further by creating custom calculations that give you even more information about the data you’re tracking.
New Contacts
Number of Contacts Added during the specified Date Range
Meetings Added by Owners
Number of Meetings Added regardless of Outcome during the specified Date Range split up by Owner
Deals Won Amount by Pipeline
Revenue from Deals Won during the specified Date Range split up by Pipeline.
Expected Revenue
Expected Revenue during the specified Date Range.
Emails Logged
Number of Emails Logged, Overall, regardless of outcome during the specified Date Range.
Open Deals
Number of Open Unclosed Deals during the specified Date Range.
Explore Dozens of Pre-Built Sales Dashboard Templates
With 40+ pre-built sales dashboard templates that can be setup in minutes, we’ve got you covered. Track your sales performance from tools like Hubspot CRM, Pipedrive CRM, Salesforce, Stripe, and many more. Download the free template, connect your data sources, and get instant visualizations of your key marketing metrics in minutes.
What Else Can You Do With Databox?
Make your performance more predictable with Databox’s array of top-tier features that help sales leaders build dashboards, track performance, and report results with ease.

Dashboard Designer
No more fumbling around trying to visualize data in spreadsheets or slides. With our DIY Dashboard Designer, anyone can pull the metrics they need, visualize KPIs in a variety of ways, and build meaningful dashboards–no code or design skills necessary.

Calculated Metrics
With Data Calculations, you can combine data from multiple sources and easily calculate new metrics, KPIs, conversion rates, ROI, and much more — all without coding or spreadsheets.

Goal Tracker
Goals aren’t hit in a spreadsheet. With Databox, you can visualize your goals against current performance so you can make adjustments when they matter most.

Looped Dashboards
With amazing reporting features like Looped Dashboards, you can connect multiple dashboard reports together in one centralized report and easily share it with others.

Custom Metric Builder
Sometimes the preconfigured metrics from the tools you use aren’t enough. Use dimensions and filters to build custom metrics that allow you to pull more granular performance insights. With Query Builder, anyone can build the specific metrics they need without any engineering work.

TV Dashboards
Whether you’re viewing performance from your desktop, phone, TV, or even your wrist – Databox makes your data accessible no matter where you’re viewing it.
Start Building Your Sales Dashboard
No more logging into dozens of different tools to understand performance—now you and your team can easily connect your data, build and share reports, monitor trends, and discover insights.
Try it Free for 14 DaysFrequently Asked Questions
Which software is best for dashboard?
While many sales and marketing tools include analytics features, Databox allows you to connect all of your favorite tools in one place, like Hubspot CRM, Salesforce, Stripe, and Google Analytics. Find out more about our native and third party integrations.
Which software is used for dashboard?
Databox is a sales dashboard software. With hundreds of one-click native integrations with the industry’s top social media platforms and marketing tech, it’s simple to connect your most-loved data sources to Databox.
Do you offer special Agency features?
We do! Features for agencies include: client management, client performance monitoring, templated reports, annotation capabilities, and alerts & notifications. Find out more about agency features here.
How do I create a sales dashboard?
To connect your first integration in Databox, find it in Data Sources, then just log in to connect. Drag & Drop metrics right into your dashboard and watch as they automatically populate with your data and chosen visualization type. Resize and rearrange your datablocks, add metrics from other data sources, and track all of your marketing metrics from any source in one place.
What should a sales dashboard include?
A sales dashboard might includes:
- Sales leads metrics
- Sales team activities
- Your sales pipeline KPIs
- Your sales funnel performance
- Call tracking details
- Events from your CRM
- Business development initiatives
- Overall sales performance
Want a head start? Databox has 40+ free sales dashboard examples and templates that come pre-built with some of the most commonly tracked metrics from the most popular tools. Customize your templates at any time. Check them out and create your Databox account to get started.
Which sales data source integrations do you support?
We have 100+ one-click integrations, including: Hubspot CRM, Stripe, Salesforce, and CallRail. Find out more about our native and third party integrations.
How do I build a sales scorecard or report?
Databox Scorecards send you updates on your key performance indicators (KPIs) through email, mobile push notification, and/or Slack every day, week, or month. We also support scheduled Snapshots, embedding your databoards, Looped databoards, and offer white-labeling.


GDPR
compliant
compliant
certified