
4.5 out of 5 stars

2024 High Performer on G2
4.8 out of 5 stars
The Only SQL Dashboard Software That’s Free & Easy to Set Up
Databox is a custom SQL server dashboard tool that allows you to visualize, analyze, and report on database performance in one place.
Try it Free for 14 DaysBook a Demo


How to Build a SQL Dashboard
Connecting your SQL database to Databox is as simple as configuring access to your server, entering your credentials in Databox, then authorizing the app.
Once you’re connected, you can begin building your metrics by writing SQL statements inside Databox using the Query Builder feature. From there, Drag & Drop metrics right into your dashboard and watch as they automatically populate with your data and chosen visualization type. Resize and rearrange your datablocks, add metrics from other data sources, and track all of your key business metrics from any source in one place

No more manual reporting. Once you build a dashboard, you can schedule automated snapshots of your dashboard to be emailed to members of your team on the day and time of your choosing, automate notifications in Slack, or simply grab a shareable link to share with your team.
Connecting your SQL database to Databox is as simple as configuring access to your server, entering your credentials in Databox, then authorizing the app.
Once you’re connected, you can begin building your metrics by writing SQL statements inside Databox using the Query Builder feature. From there, Drag & Drop metrics right into your dashboard and watch as they automatically populate with your data and chosen visualization type. Resize and rearrange your datablocks, add metrics from other data sources, and track all of your key business metrics from any source in one place
No more manual reporting. Once you build a dashboard, you can schedule automated snapshots of your dashboard to be emailed to members of your team on the day and time of your choosing, automate notifications in Slack, or simply grab a shareable link to share with your team.

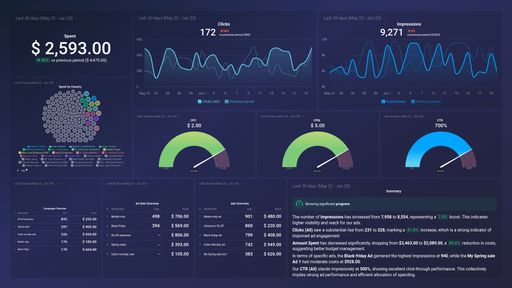
Visualize the Data in Your Database in a Whole New Way
Create custom metrics by writing SQL statements inside Databox using our Query Builder feature. Pull or calculate values just like you would natively in your database. Once you’ve created your metrics, add them to dashboards and reports, set up goals or even calculate new metrics by adding, subtracting, dividing or multiplying with data from other data sources. Once you have everything set up the way you want, view the peaks and valleys of your trendlines, compare to previous date ranges, and/or create forecasts for the ultimate visual breakdown of the data in your SQL database.
Try it Free for 14 Days
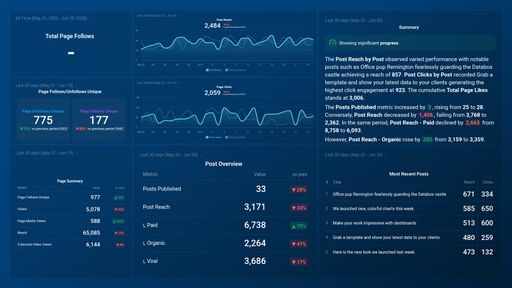
Connect with Critical Data Sources to Go Deeper
Databox has 100+ one-click integrations, meaning you can plug in additional tools and find new and exciting data points about your business. Try connecting with your payment processor to correlate sales with your database data and create new, custom application metrics to measure the health of your business. Begin optimizing from there for maximum benefit.
Try it Free for 14 Days
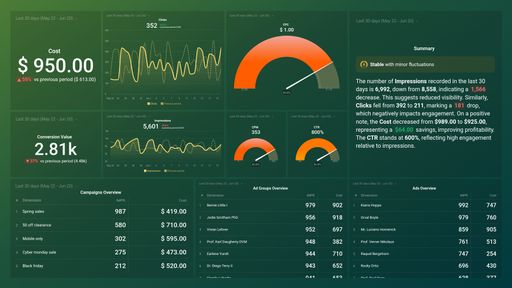
Expand the Possibilities of Reporting
Go beyond our native integrations and connect any tool to your Databox account as a custom integration by feeding it into your owned SQL database. The sky’s the limit.
Try it Free for 14 Days
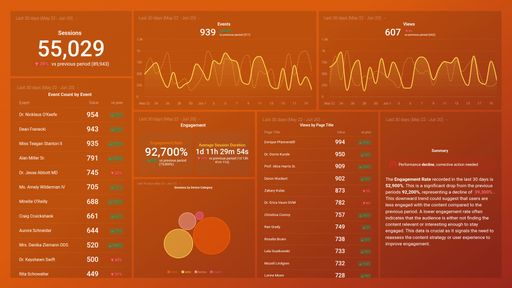
Empower Your Teammates Who Don’t Code
Once set up, your low-code (or no-code) colleagues can pop into the Databox app to create beautiful and professional reports straight from your database in minutes. With drag and drop functionality, adjusting your SQL server dashboard is a breeze. And forget pulling manual reports—with Databox, you can send Snapshots of a single databoard, Scorecards that give a quick overview of your most important health metrics, Looped Databoards that connect multiple dashboards together to tell a more comprehensive data story or pdf reports with an explanation of your results. There are so many ways to share your data that you’ll never have to waste time manually putting together a SQL database report again.
Try it Free for 14 DaysWhat our customers say about us...

“It’s just awesome to be able to pull reports from our production database and show it in a really easy and beautiful way.”
George ValdesHead of Marketing at Monograph

“In Query Builder we can basically create any metric. Most clients say, ‘Wow, this is amazing.’ Being able to give those kinds of reports to clients really helps you stand out.”
Robbie RichardsCEO & Founder at Virayo

“I can calculate things. I can not only put the data in one place but now I can put together a specific piece of data, calculate it, and get new data that we never reached before. That’s an insight important to our clients and us.
Gabriel MarguglioCEO at Nextiny

Boost Your SQL Dashboard with Our Library of One-Click Integrations
The easiest way to connect your data with Databox is through any of our 100+ one-click integrations.
Explore 100+ Dashboard Integrations
Replicate Existing SQL Dashboards
Got something already set up elsewhere? No problem—using Databox’s Query Builder, you can enter custom SQL statements to get that same data, or go beyond and customize it even further using our Data Calculations feature. With so many ways to slice and dice your data, there’s no end to what you can learn about what you’re measuring.
Explore Our Dashboard Templates
With 50+ pre-built business dashboard templates that can be setup in minutes, we’ve got you covered. Track your business performance from tools like Google Analytics, Hubspot CRM, Help Scout, Mailchimp, and many more. Download the free template, connect your data sources, and get instant visualizations of your key business metrics in minutes.
What Else Can You Do With Databox?
Make your performance more predictable with Databox’s array of top-tier features that help businesses build dashboards, track performance, and report results with ease.

Dashboard Designer
No more fumbling around trying to visualize data in spreadsheets or slides. With our DIY Dashboard Designer, anyone can pull the metrics they need, visualize KPIs in a variety of ways, and build meaningful dashboards–no code or design skills necessary.

Calculated Metrics
With Data Calculations, you can combine data from multiple sources and easily calculate new metrics, KPIs, conversion rates, ROI, and much more — all without coding or spreadsheets.

Goal Tracker
Goals aren’t hit in a spreadsheet. With Databox, you can visualize your goals against current performance so you can make adjustments when they matter most.

Looped Dashboards
With amazing reporting features like Looped Dashboards, you can connect multiple dashboard reports together in one centralized report and easily share it with others.

Custom Metric Builder
Sometimes the preconfigured metrics from the tools you use aren’t enough. Use dimensions and filters to build custom metrics that allow you to pull more granular performance insights. With Query Builder, anyone can build the specific metrics they need without any engineering work.

TV Dashboards
Whether you’re viewing performance from your desktop, phone, TV, or even your wrist – Databox makes your data accessible no matter where you’re viewing it.
Start Building Your SQL Database Dashboard
No more logging into dozens of different tools to understand performance—now you and your team can easily connect your data, build and share reports, monitor trends, and discover insights.
Try it Free for 14 DaysFrequently Asked Questions
Can we make a dashboard in SQL?
Databox is a SQL server dashboard tool. Connect a SQL database, then write SQL directly inside Databox to create metrics that can be visualized in the Databox Designer.
Which SQL data source integrations do you support?
We support PostgreSQL, MySQL, Google BigQuery, Amazon RedShift, Microsoft SQL Azure, Microsoft SQL Server, and Snowflake. Find out more about our native and third party integrations.
Do you offer special Agency features?
We do! Features for agencies include: client management, client performance monitoring, templated reports, annotation capabilities, and alerts & notifications. Find out more about agency features here.
What is a SQL dashboard?
A SQL dashboard takes information directly from your relational database and brings it to life through visualization elements such as charts, graphs, and tables. Databox is a SQL dashboard software that allows you to connect your database and write SQL directly inside Databox to create metrics that can tell you even more about your product and customers.
How do I build a SQL scorecard or report?
Databox Scorecards send you updates on your key performance indicators (KPIs) through email, mobile push notification, and/or Slack every day, week, or month. We also support scheduled Snapshots, embedding your databoards, Looped databoards, and offer white-labeling.

Clear answers,
as fast as you have questions.
Compare
Databox Inc.
HQ: Boston, MA, USA
AI-powered analytics for teams that need answers now.
Databox Inc.
HQ: Boston, MA, USA

AI-powered analytics for teams that need answers now.


Compare