Uses one-click integrations:
-
 Google Ads
If you don't use Google Ads, you can pull data from any of our 130+ one-click, native integrations or from spreadsheets, databases and other APIs.
Try this dashboard for freeWhat you’ll learn from this Google Ads Dashboard Template:
Analyze your campaigns, ad groups, keywords, and engagement metrics to improve your return on investment (ROI). By connecting your Google Ads account, you’ll learn:
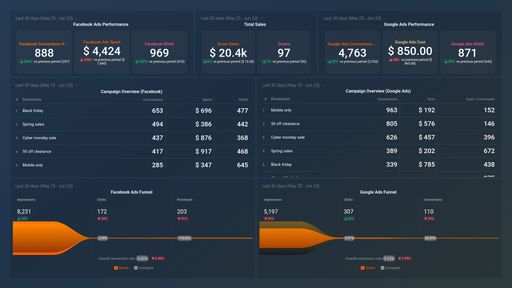
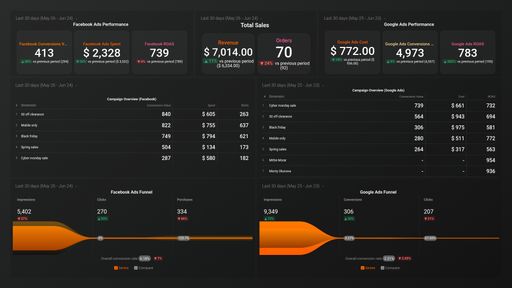
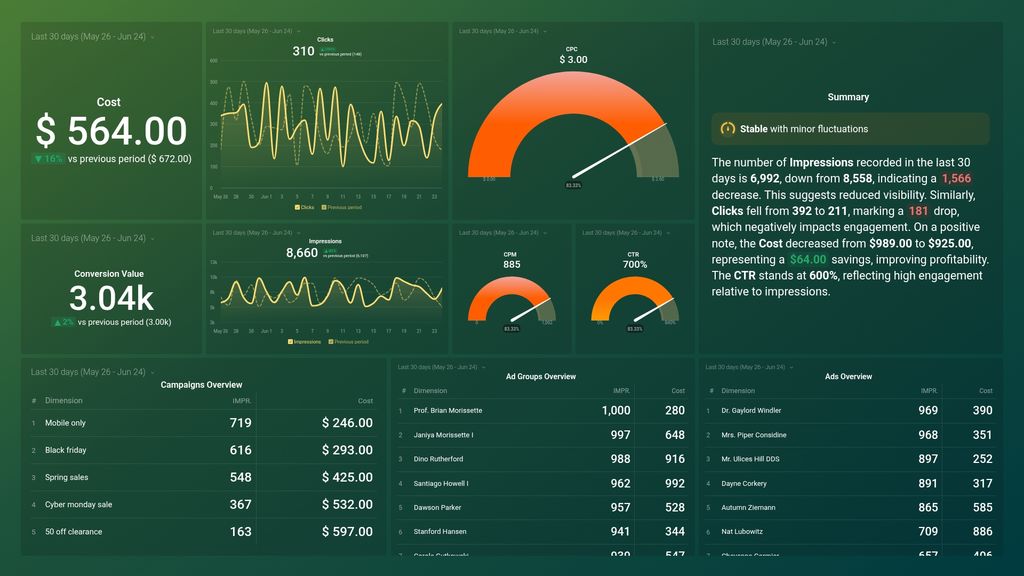
- Which ads generate the most engagement? Get complete insight into your active Google Ads campaigns and easily track their performance. See how many impressions each campaign accrued, as well as the ratio of people who clicked on your ad upon seeing it.
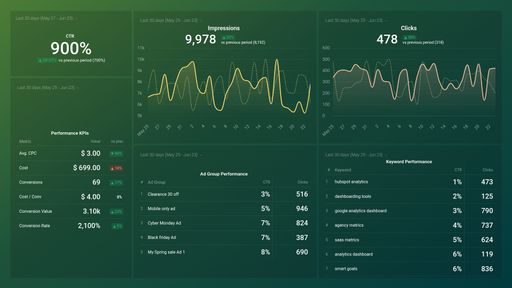
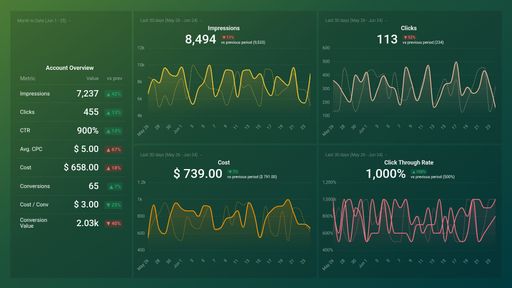
- How do I monitor my Ad Impressions data? View the total number of times your ad was shown/seen on Google or the Google Network daily, weekly, monthly, yearly, or within the specified date range.
- How many times was my ad clicked on? Visually monitor the number of clicks your ad receives daily. It helps track this data as it is a good indicator that your ad is compelling and valuable to the people who come across it.
- How much do I pay for each click on my Ad? See the amount you pay on average for each click your ad receives. If your ad CPC is too high, you might want to consider alternative keywords to target, lower and adjust your bids, make your ad more relevant, etc.
- How many users completed the desired action after clicking on your ad? Learn whether your ad clicks are resulting in users taking some desired action. If your conversion rate is low, you need to look further into why this is the case. Are you targeting the wrong people? Or are you using the wrong (poor) keywords? Is your Ad copy not compelling enough/relevant?
- How much on average does conversion on my ad cost? See how much you get charged for each desired action taken by a user after coming across your ad. Compare your cost per conversion value against your target amount to determine the return on your ad investment. Are you paying more or less?
Pull additional data using our robust integration with Google Ads.
What else can you track and visualize with our deep integration with Google Ads? When it comes to analyzing your campaigns, pretty much anything:
- Impressions, clicks, and conversions
- Cost analysis
- Keyword analysis
- Conversion analysis
- Engagement by Ad, Ad Group, and Ad Campaign, and more
There are numerous metrics and metric combinations you can track using Google Ads. And in Databox, you can quickly visualize dozens of Google Ads metrics in various ways.
Read more about Databox’s Google Adwords integration.
Google Ads metrics included in this template
- Cost by Ad
- Cost by Ad Group
- Impressions by Ad Group
- Impressions by Ad
- Avg. CPM