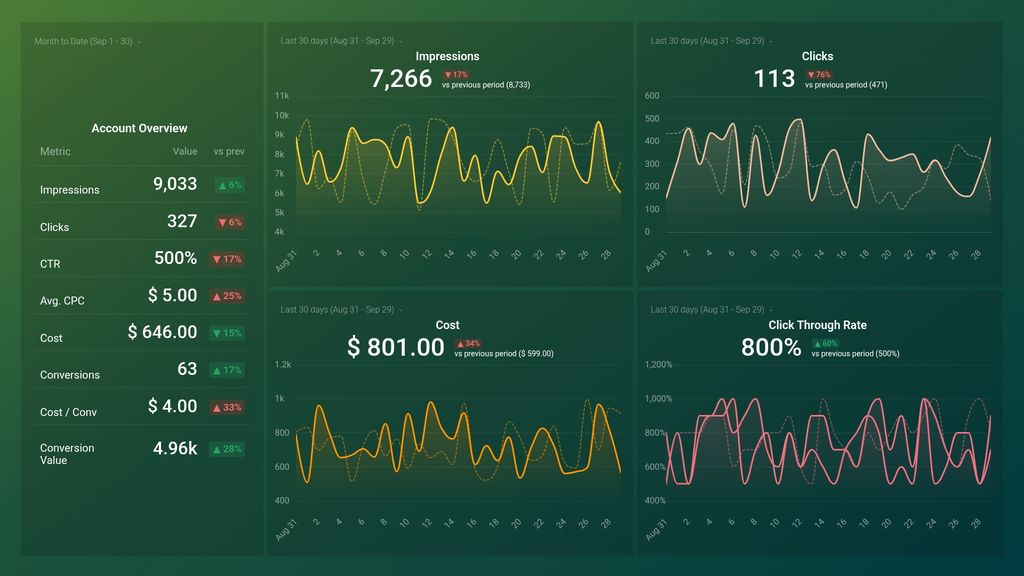
What you’ll learn from this Google Ads (Competitive Health) Dashboard Template:
By connecting your Google Ads account, you’ll learn:
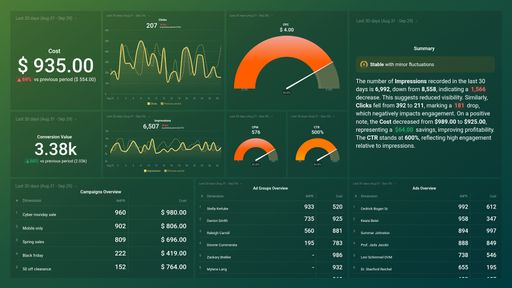
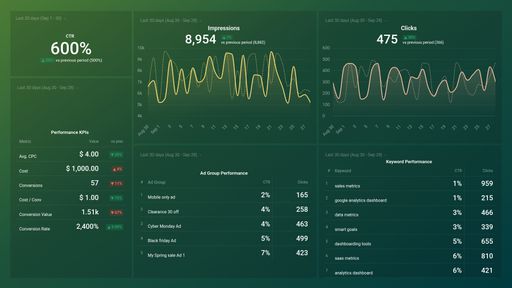
- Am I losing clicks and impressions to my competitors? Track the number of clicks and impressions your ad received for the selected time period. Look out for sudden dips in click and impression volume, as this is an indicator that your competitors might have new ad campaigns set up or are bidding more aggressively for the same keywords that you are.
To be sure, do a simple test by searching for some of your target keywords to see which advertisers pop up. If this is the case, you might want to seek out more creative ways to stand out.
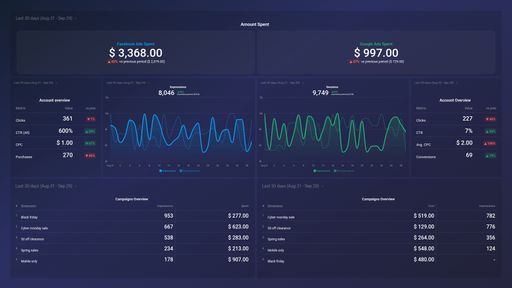
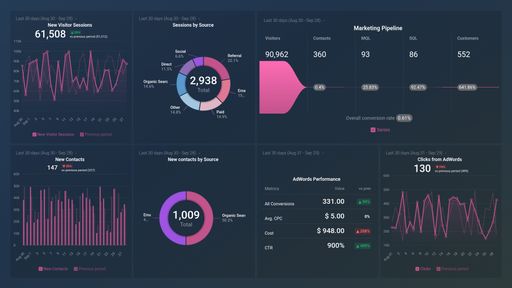
- How do I measure my Google ad campaign performance? Measure the effectiveness/success of your Google Ads campaigns by tracking your most important Google ads metrics, including impressions, clicks, CTR, cost, conversions, and so on. Use this data to determine if your efforts are paying off.
- What percentage of impressions resulted in a click? Gauge the performance of your target keywords and ads based on the ratio of people who click on your campaign when they see it. Low CTR indicates that your ad viewers do not consider your ad to be relevant or valuable, which means you end up losing them to your competitors.
- How much am I being charged for a click on my ad? See how much you pay for clicks on your ad campaign daily. Look out for spikes or dips in your average CPC data from competitors aggressively bidding up CPCs.
- Impressions, clicks, and conversions
- Cost analysis
- Keyword analysis
- Conversion analysis
- Engagement by Ad, Ad Group, and Ad Campaign, and more
Pull additional data using our deep integration with Google Ads.
What else can you track and visualize with our deep integration with Google Ads? When it comes to analyzing your campaigns, pretty much anything:
There are numerous metrics and metric combinations you can track using Google Ads. And in Databox, you can quickly visualize dozens of Google Ads metrics in various ways.
Read more about Databox’s Google Ads integration.