


Table of contents
When the average small to mid-sized business spends $9,000-$10,000 every month on Google Ad campaigns, tracking ROI becomes a requirement.
The only problem? Collating all of the data you need in one place can be complicated. You might need to apply filters and drill down into each campaign in order to pull real insights.
Not to mention it’s almost impossible to share those results with your team without manually copying the results into an Excel sheet (a total timewaster.)
There is an easier way to do this: by building a custom Google Ads dashboard.

Why bother with a custom Google Ads dashboard?
You can see important results about your PPC campaigns directly inside your Google Ads account. Why bother creating a custom PPC dashboard?
Raquel Comperido of Right Buddy thinks you should “create a custom dashboard to allow you to look at your performance statistics – across all campaigns and accounts. This helps you quickly review the data that is important and reduces information overload issues.”
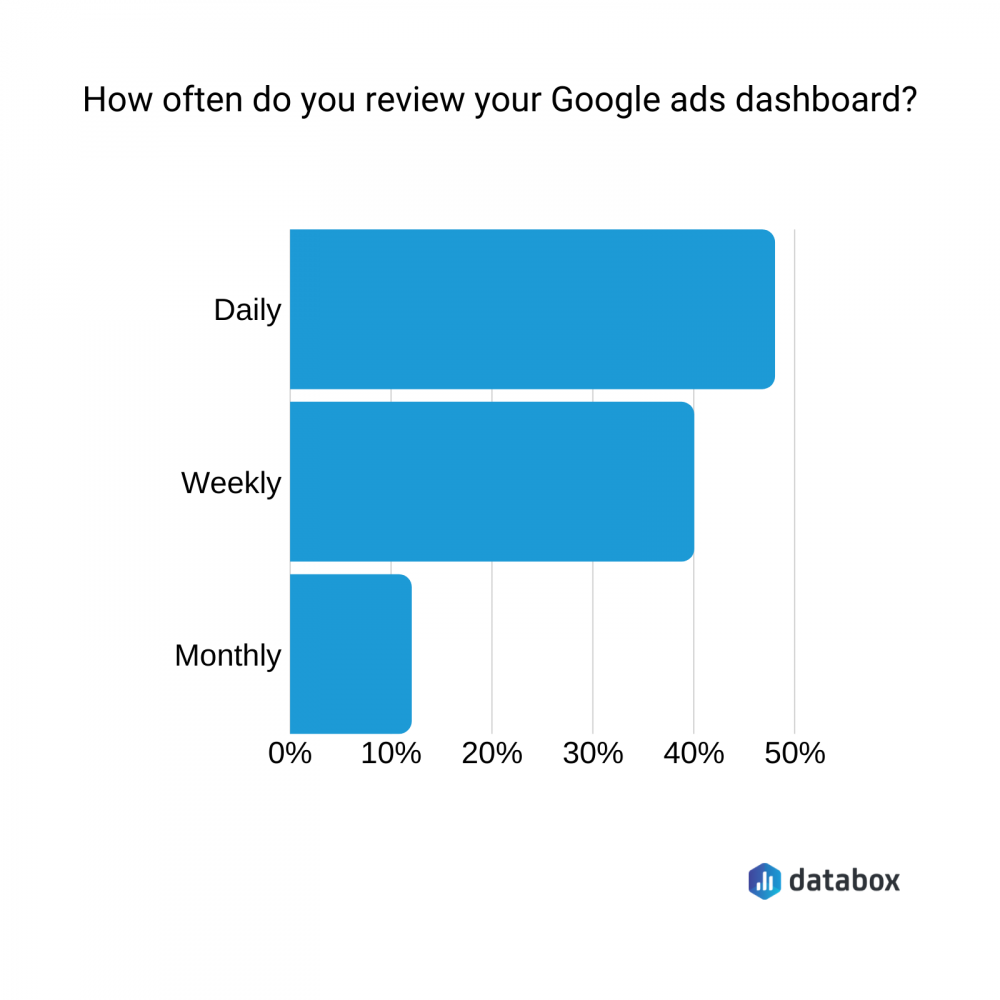
Plus, the majority of marketers review their Google Ads dashboard daily. By creating a custom business dashboard with your most important metrics, you can easily spot areas for improvement:
How to create a custom Google Ads dashboard
Now we understand the value of creating a custom Google Ads dashboard, what tools and tips can you use to create your own?
We asked 30+ experts who shared their techniques, including:
- Pick the right metrics
- Report on bottom-line data
- Make your dashboard visual-heavy
- Use data to make PPC decisions
- Focus on the campaign goal
- Automate data syncs
- Filter your data
- Compare metrics by month
- Use Google Data Studio
- Set-up accurate tracking
- Link results to ad spend
PRO TIP: Here Is Your Go-To Dashboard for Monitoring Your Google Ads Campaigns in One Place
To monitor and improve the performance of your Google Ads campaigns, you can spend hours running a variety of reports and compiling selected metrics manually into one dashboard. Or, you can pull all your data automatically into one dashboard with Databox.
You can instantly review all of your campaigns and drill down on important metrics, such as:
- Campaign overview. Which ads generate the most engagement? Get complete insight into your active Google Ads campaigns and easily track their performance.
- Impressions. View the total number of times your ad was shown/seen on Google or the Google Network daily, weekly, monthly, yearly, or within the specified date range.
- Clicks. Visually monitor the number of clicks your ad receives daily. It helps track this data as it is a good indicator that your ad is compelling and valuable to the people who come across it.
- Cost. How much do I pay for each click on my ads? See the amount you pay on average for each click your ad receives.
- Conversions. How many users completed the desired action after clicking on my ads? Learn whether your ad clicks are resulting in users taking some desired action.
- Cost per Conversion (CPC). How much on average does conversion on my ads cost? See how much you get charged for each desired action taken by a user after coming across your ad.
Now you can benefit from the experience of our Google Ads experts, who have put together a plug-and-play Databox template showing all the key insights you need to optimize your Google Ads campaigns for conversion and ROI. It’s simple to implement and start using as a standalone dashboard or in PPC reports!

You can easily set it up in just a few clicks – no coding required.
To set up the dashboard, follow these 3 simple steps:
Step 1: Get the template
Step 2: Connect your Google Ads account with Databox.
Step 3: Watch your dashboard populate in seconds.
1. Pick the right metrics
You’ve got tons of data available inside your paid ads dashboard.
But According to Tidio‘s Maria Pietruszewska, “choosing comprehensive and actionable metrics is imperative for composing a Google Ads dashboard. Just by looking at it, you (or a person you’re sharing it with) should be able to easily determine if your PPC efforts are on the right track.”
“If you go in too deep, you may as well ditch the dashboard and head to Google Ads to dig into those tabs. On the other hand, if they’re too superficial, you’ll find yourself doing the exact same thing but in search of any useful data.”
Datis Mohsenipour of Outback Team Building & Training agrees: “Don’t go into the minutia of things. Your dashboard should contain high-level KPIs and data that will “alert” you should something be trending in the wrong direction.”
“If something is trending negatively, your paid search dashboard will catch it and trigger you do look deeper under the hood.”
Related: The 28 Advertising KPIs That Every Marketer Should Be Tracking
2. Report on conversions and bottom-line data
So, what are the most important metrics to track using a custom dashboard software and include on your Google Ads dashboard?
Webolutions‘ John Tarr thinks you should “focus on cost per conversion, or the most important metric to the client. Dashboards have a tendency to get overcomplicated. Lead with the most important metric first.”
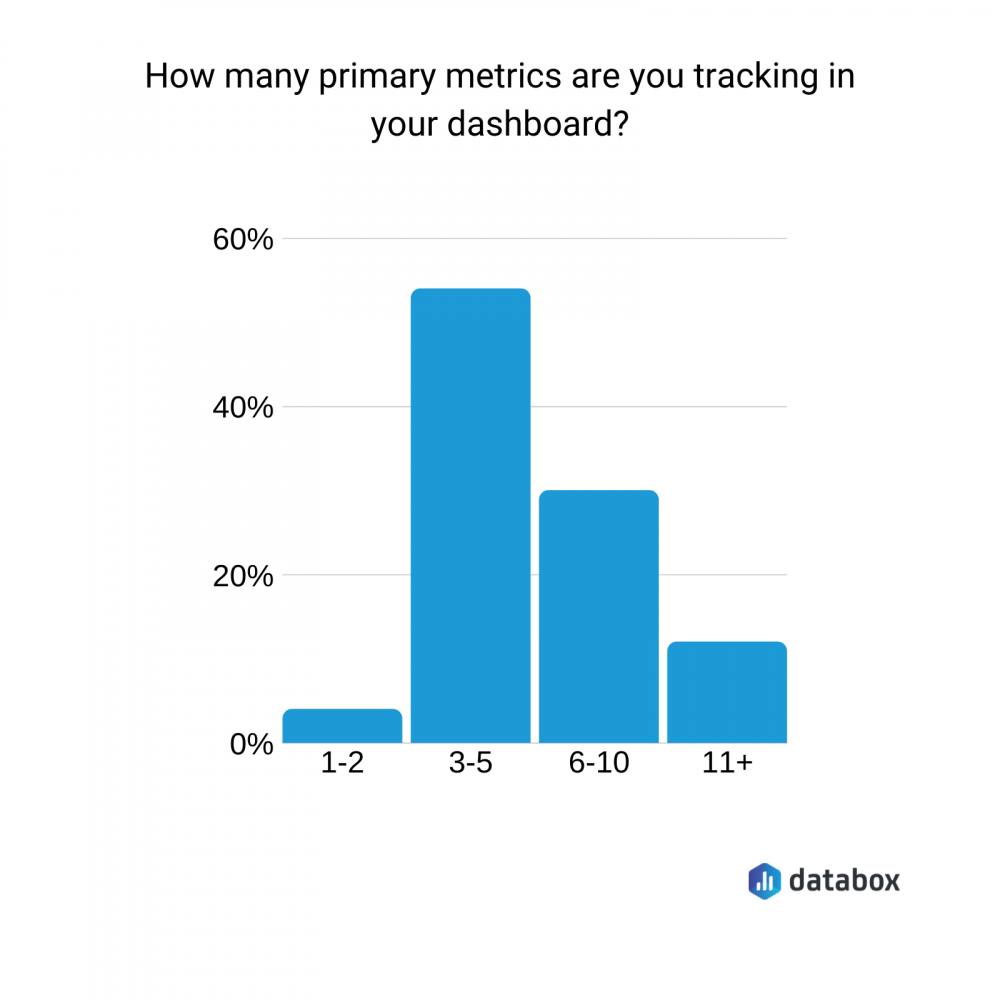
This is likely why most marketers only use 3, 4, or 5 metrics on their KPI dashboard:
Similarly, Grant Higginson of Welby Consulting adds: “It’s critically important that any Google Ads performance dashboard includes conversion data such as number of conversions, cost per conversion, conversion value, ROAS. By keeping your dashboard conversion & business-goal focused you’ll be able to make better decisions in the long-term.”
Matt Slaymaker of Folsom Creative also says: “For most clients, conversions will be the number one priority, so they will want to see 1) how many conversions they received, 2) the cost associated with gaining those conversions, and 3) the keywords/campaigns that were responsible for generating the conversions. As long as the client is seeing their sales/leads increase in a sustainable, profitable manner – they will be satisfied.”
It’s why Matthew Slaymaker of Folsom Creative recommends to “highlight the data that your clients care about the most – conversions. I always include 3 metrics at the very least: Goal Overview, Campaign Overview, and Cost per Conversion.”
Summarizing, SilverTech‘s Lindsay Moura adds: “Don’t get bogged down by vanity metrics. Instead, focus on the key performance indicators (KPIs) that will have a meaningful impact on your bottom line (e.g. conversions and brand impression share).”
3. Make your dashboard visual-heavy
When creating your own dashboard, Epignosis‘ Ana Casic thinks you should “know what metrics you want to show before starting playing around with all the beautiful graphics.”
“Try to keep it simple yet show all the necessary information while cutting out the clutter.”
According to Directive‘s Liam Barnes, this can help your VP or Director of Marketing–the second-most common people to view a Google Ads dashboard.
Barnes explains: “Our charts should accurately present the data in a way that is easy to understand, that way when you are presenting the data to higher-level executives, there is no question of what they are looking at.”
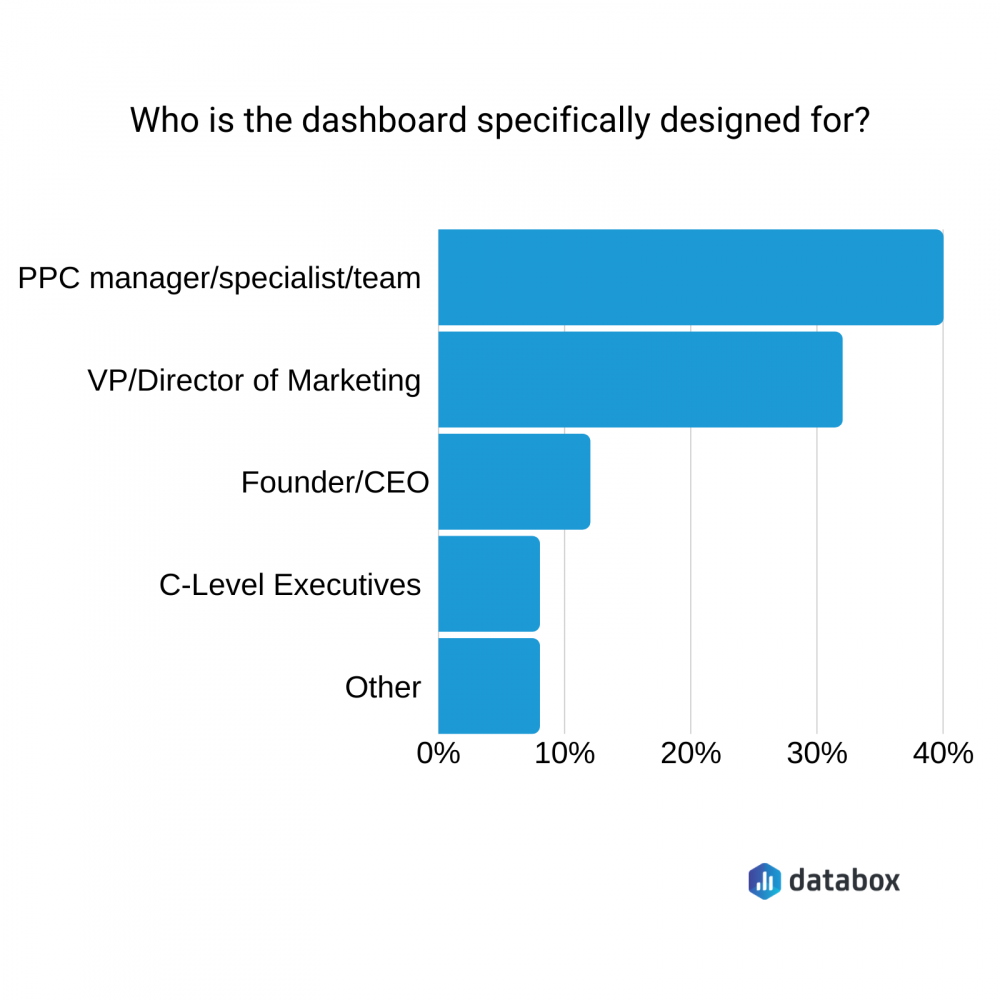
In fact, the audience of your dashboard depends on the metrics you should prioritize, as Revenue River‘s Diana Nguyen explains: “Director of Marketing will care more about the bid details or campaign performance. While the C-Level Executives are more concerned with bottom-line results.”
Similarly, Josh Gallant of Foundation Marketing thinks you should “make sure you can visualize each step you’re asking visitors to take once they click on your ad. This’ll make sure you know exactly where your funnel is leaking and where you need to focus your optimization time.
“And don’t just stop at the high-level funnel view of click -> demo request either—actually break down the micro-conversions you’re trying to get visitors to take all along the way.”
Gallant explains: “For example: Ad impression > session > click CTA button > interact with form field > submit form > successful conversion.
“If no one’s clicking your CTA button, spending all of your optimization time on the form isn’t going to solve your conversion problems.”
4. Use your dashboard to make PPC decisions
The data you’ve already collected from previous campaigns is a goldmine for advertisers. It shows you what worked (and what didn’t.)
For example, Junaid Ahmed of LambdaTest says: “Don’t opt for automated bidding strategies without enough conversion data available on the Google Ads dashboard.”
Toni JV of JVT Media adds: “The point of a dashboard is so that you can quickly glance over and look at all your most important data at once. This will reveal issues in your ad, which you can then go and optimize.”
“If you go to your dashboard and see that conversion rates are awful, you can now go and optimize your website to convert better. Or if your CTR is bad, you can go and optimize the title of your ad and see how you could make it more enticing.”
“Keep doing this month after month and your ads will be better and better over time,” JV adds.
5. Focus on the campaign’s goal
“You need to focus not only on the campaign’s goal but also on the company’s needs,” says Elena Escala of Opportunity Network.
“The primary question is: what is your company using Google Ads for? For example, a media agency would require a dashboard with many more fields than a Jewelry manufacturer’s page. Where the former may be targetting different clients for leads, bookings or sales the latter has specific metrics that directly measure business success.”
“Therefore, when setting up a dashboard for Google Ads the most important thing is to have a clear understanding of your business. Then you can focus on the metrics that are relevant and will be followed-up on a daily or weekly basis.”
Intigress‘ Anna Gorecki agrees: “The best thing you can do when creating a google ads dashboard is to include the metric that is measuring your goal.”
“For example, if you are aiming for target CPA, the CPA needs to be in the dashboard or if you are aiming for a higher number of leads, the number of leads generated from ads needs to be in the dashboard.”
Joe Karasin of POSH Digital Media adds that “keeping accounts separated helps.”
“If I have a set of ads that are set up as “click to call”, then those go in one account. I can separate them at the ad group level, but the organizing by my objectives allows me to track the metrics most valuable for that particular account with ease.”
Summarizing, Augurian‘s Jasmine Hippe adds: “Don’t overwhelm the dashboard with data. Decide on a set of KPIs and report solely on those metrics. This paints a clear picture of how the account is performing based on your predetermined vision for success.”
Related: The 10 Most Important Google Ads Metrics [Original Data]
6. Automate data-pulling for your dashboard
“We live in a technological society and it would be a shame if you have to manually check your Google dashboard,” says Anh Trinh of GeekWithLaptop.
“In your dashboard, you can set it to send you data at regular intervals. You can use it to send KPIs and other metrics to you weekly, monthly, quarterly, etc.”
“At Kiwi Creative, we use Google Ads Databoards in Databox to provide a high-level overview of how campaigns are performing. The native analytics within Google Ads are very robust, so we use our dashboard to track performance to boost our clients’ knowledge,” says Dylan Zsigray.
“When we create a Google Ads dashboard, we emphasize simplicity while ensuring enough data points are tracked. We track the total cost accrued in the campaign(s), the total impressions, clicks, CPC, and CTR. We also provide a specific look into the strongest ad groups and keywords to provide insight into what is working and what needs to be optimized.”
Zsigray continues: “The key when creating a Google Ads dashboard, along with any paid media dashboard, is to ensure it’s not overwhelming to those who look at it while also providing enough information for their benefit.”
Editor’s note: Besides automating data pulling for any dashboard, did you know that with Looped Dashboards in Databox, you can connect multiple dashboard reports together in one centralized report and seamlessly share it with others? Get started now.
7. Filter your data
“One tip when creating a Google Ads dashboard is to filter the data in a few different ways,” says Noelle Del Grippo of Sagefrog Marketing Group.
“For instance, in our Google Ads board we have 3 similar boxes pulling similar information (Avg. CPC, conversions, CTR) however each box looking at the data from a different angle, one box is looking at the Ads account as a whole, another is broken down to look at each campaign and how they performed, and another is broken down by keywords.”
“Looking at the data from these different layers helps you dive more into the data to see which campaign or keyword is performing well or what campaign/keyword is costing more but not performing.”
Grippo adds: “This data can help make recommendations to help improve the Ad accounts performance.”
This is why ParkFellows‘ Taylor Randolph advises to “create a card on your Google Ads dashboard to see data on cost, clicks, and conversions for Devices. You might find that mobile users are more likely to click on the ad, but less likely to convert. This is costing your company money. If this is the case, then you can alter your bids based on the device.”
Tabitha Young of 30 Degrees North adds: “It isn’t helpful to know that your overall CTR is 7.5% if you have one campaign that is struggling to get a 1% CTR. I typically like to break out each campaign by Impressions, Clicks, CTR, Avg CPC, conversions, and cost. This helps our clients really understand how each campaign is truly performing.”
You can also do this for new visitors, as Mailbird‘s Andrea Loubier explains: “When creating your dashboard for Google Ads, it’s really important to be sure that you’re monitoring new visitors.”
“Sure, it’s great to increase your numbers on any visitors. However, if you’re attempting to attract new customers, this is the best way to see if your strategies are working.”
DigiRaver‘s Emilly Leia summarizes: “Keep all the account and campaign-level KPIs summarized on the first screen of your dashboard. Follow that by an ad group and keyword level breakup. Also include quick insights for factors such as device, location, time of the day.”
8. Compare data by month
Do you know how your PPC performance changes after a specific event?
Seasonal trends, a new hire, and a month-by-month change in strategy can all have an impact on your Google Ads campaigns.
For this reason, Greg Trahan of Digital Ads Optimism advises to “make sure to have percentage changes from the last period enabled. This will help you to quickly identify changes in performance. It also makes it easier to monitor the impacts of strategic changes.”
9. Use Google Data Studio
“One tip for creating a Google Ads dashboard is to leverage Google Data Studio,” says Andrew Becks of 301 Digital Media.
“With out-of-the-box integrations for Google products (Ads, Analytics, Campaign Manager, etc.) and some pre-built templates to get started, Google Data Studio makes it super simple to create visually-appealing dashboards that can be easily shared and saved.”
Growth Hackers‘ Jonathan Aufray adds: “To create a powerful Google Ads dashboard, I recommend using Google Data Studio. This is a free tool helping you gather multiple data points and metrics in a comprehensive way.”
Plus, Julien Coquet of MightyHive says: “In DataStudio for instance, [you can] use color-coding to indicate whether that margin is positive and/or within a given margin percentage. Don’t hesitate to use date comparisons to show progress!”
10. Set-up accurate tracking before launching your campaigns
Regardless of what metrics you’re reporting on, DeAnalyst‘s Joseph Tsaker advises to “setup proper tracking before publishing your ads [because] without proper measures on your campaign performance, you may merely be wasting advertisement budget.”
“Fortunately, the AdWords platform makes it possible for you to set up UTM tracking parameters on URLs that you are advertising on, and measure performance with your Google Analytics. So Google Ads dashboard creation should start with a proper Google Analytics set up, then, a proper campaign measurement.”
That’s why QuickQuote‘s Melanie Musson adds: “Use UTM codes to track ad campaigns. It’s vitally important to not just see success or failure of ads but to know exactly what kind of response each specific ad is.”
Summarizing, MakeWebBetter‘s Syed Faizuddin says: “After creating a Google Ads dashboard, make sure your conversions are tracked correctly. And you must use only one of these methods, either Google Ads Auto-Tagging or UTM tracking to measure the true success of an ad campaign.”
11. Link results to Google Ads spend
It’s all well and good to look at your Google Ads and see that you’ve generated $30,000 in sales. But how much did you spend to make that revenue?
For this reason, Futurety‘s Sam Underwood advises to “always include spend for that time period.”
“It’s easy to look at rate stats (CPCs, conversion rates, and so on) and draw big conclusions about market size and opportunity, but it’s helpful to always put things in context. Increasing conversion rate by 0.1% on your largest campaign will likely have a much bigger impact than if you increase it by 5% on your smallest campaign.”
Related: 18 Ways to Improve the Google Ads Quality Score of Your Next Campaign
Final Thoughts
Stop relying on Google Ads’ auto-generated reports to show you how well your campaigns are performing.
Start creating your custom dashboards with a business dashboard software to easily spot how your campaigns are affecting business, and make it easier to share with stakeholders (or clients.)
Not sure where to start? Browse through 300+ pre-built Databox dashboard templates now and find your perfect match.


