


![The 10 Most Important Google Ads Metrics [Original Data]](https://cdnwebsite.databox.com/wp-content/uploads/2018/04/09130408/TopAdWordsMetricsBG.jpg "The 10 Most Important Google Ads Metrics [Original Data]")
Table of contents
Successful advertising is all about matching your promotion with the user’s intent.
While intent itself is hard to measure, the digital ad landscape has given marketers and advertisers the ability to leverage user data to get closer than ever to matching their promotion with the people who need and/or want it most.
Perhaps no platform does this better than Google Ads.

While other platforms, most notably Facebook Ads, can match Google when it comes to the amount of user data they have to monetize, Google still holds the holy grail—the search query.
As you can see below in the latest sampling compiled by Rand Fishkin of SparkToro, the share of searches across the web is not even close.

And nothing is a more powerful indicator of intent than what a user is searching for right now.
The moral of the story? Google Ads is arguably the most powerful ad platform when it comes to matching your promotion with user intent.
Databox users agree. According to our data, Google Ads is the most-used advertising platform of any of the platforms—Google Ads, Facebook Ads, Bing Ads, LinkedIn Ads, and Twitter Ads— that we currently integrate with.
To better understand which paid search metrics are the most important to track, we dug into our user data to identify the 10 most-tracked Google Ads metrics by measuring the number of Datablocks used.
We also asked Jake Havenridge of Smartbug Media, a Databox Premier Agency, to lend some insights from a qualitative standpoint.
Based on the paid search metrics our customers are tracking most often in Databox, here are the 10 most important Google Ads metrics.
- Impressions
- Cost
- Clicks
- Average CPC
- Conversions
- Impressions by Campaign
- CTR by Ad Groups
- CTR by Campaigns
- Cost Per Conversion
- CTR
PRO TIP: Here Is Your Go-To Dashboard for Monitoring Your Google Ads Campaigns in One Place
To monitor and improve the performance of your Google Ads campaigns, you can spend hours running a variety of reports and compiling selected metrics manually into one dashboard. Or, you can pull all your data automatically into one dashboard with Databox.
You can instantly review all of your campaigns and drill down on important metrics, such as:
- Campaign overview. Which ads generate the most engagement? Get complete insight into your active Google Ads campaigns and easily track their performance.
- Impressions. View the total number of times your ad was shown/seen on Google or the Google Network daily, weekly, monthly, yearly, or within the specified date range.
- Clicks. Visually monitor the number of clicks your ad receives daily. It helps track this data as it is a good indicator that your ad is compelling and valuable to the people who come across it.
- Cost. How much do I pay for each click on my ads? See the amount you pay on average for each click your ad receives.
- Conversions. How many users completed the desired action after clicking on my ads? Learn whether your ad clicks are resulting in users taking some desired action.
- Cost per Conversion (CPC). How much on average does conversion on my ads cost? See how much you get charged for each desired action taken by a user after coming across your ad.
Now you can benefit from the experience of our Google Ads experts, who have put together a plug-and-play Databox template showing all the key insights you need to optimize your Google Ads campaigns for conversion and ROI. It’s simple to implement and start using as a standalone dashboard or in PPC reports!

You can easily set it up in just a few clicks – no coding required.
To set up the dashboard, follow these 3 simple steps:
Step 1: Get the template
Step 2: Connect your Google Ads account with Databox.
Step 3: Watch your dashboard populate in seconds.
1. Impressions
Any time your ad is shown on a search result page via Google or the Google Network, this counts as one “impression” in Google Ads.
Essentially, it’s the number of times your ad is “seen,” although this is a term that should be used loosely—just because your ad is shown on a search result page, it doesn’t mean that the user actually saw it.
Recommended Datablock
To track impressions in Databox, Havenridge recommends the Account Overview Datablock with comparisons on:

“We like to show the impressions on a high level using the Account Overview Datablock. We set the time frame for last month and—thanks to the color-coded percentages of increases or decreases to the right—are easily able to see our overall Google Ads health.”
2. Cost
“Cost” in Google Ads is an overall metric tells you how much money you’ve spent on your ad campaign so far.
Recommended Datablock
To track cost in Databox, Havenridge recommends the Daily Line Graph Datablock:

“Cost is something that is nice to have in a graphical interface, so we use the Daily Line Graph Datablock. We also track and view cost data in the account, campaign, ad group, and keyword blocks, as well as to calculate cost-per-acquisition (CPA).”
3. Clicks
“Clicks” in Google Ads are recorded any time someone clicks on any blue, linked text in your ad.
It’s important to note that if someone clicks your ad and is unable to reach your website (404 error, wifi issues, etc.) their engagement will still be logged as a click.
Related: 26 Different Ways for Writing Search Ad Copy That Gets Clicks
Recommended Datablock
To track clicks in Databox, Havenridge recommends the Daily Line Graph Datablock with comparisons turned on:
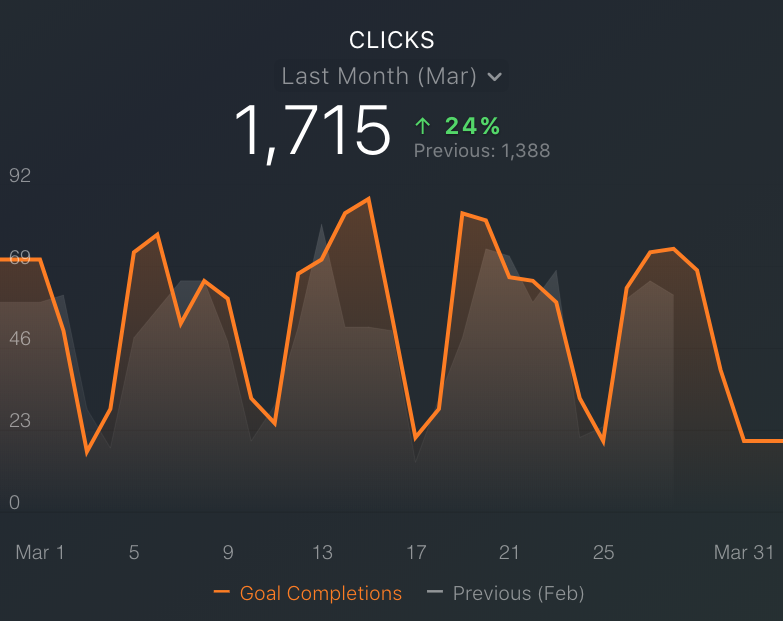
“Similar to cost, we track clicks with a Daily Line Graph block. This allows us to easily see peak performance and dips in volume, this month versus the previous month. We use clicks across account, campaign, ad group, and keyword blocks—and to calculate conversion rate.”
4. Average Cost-Per-Click (CPC)
“Average CPC” in Google Ads is the average that you’ve been charged for clicks on your ad campaign.
Your average CPC is calculated by dividing the cost of your clicks (or the amount you’ve spent on the campaign thus far) by the total number of clicks.
Related: 42 Paid Marketers Share Strategies for Lowering Your AdWords CPC
Recommended Datablock
To track average CPC in Databox, Havenridge recommends the Account Overview Datablock with comparisons turned on:

“We like to track average CPC in the Account Overview block. We set up a Google Ads metrics table block with the time frame ‘month to date’—which includes average CPC—that gives an overview in a clean, effective display.”
5. Conversions
“Conversions” in Google Ads are counted whenever a user clicks your ad and then takes an action that you’ve defined as important (i.e. a visit to a specific web page, a signup, etc.).
Recommended Datablock
To track conversions in Databox, Havenridge recommends the Number Datablock with comparisons turned on:

“Conversions are tracked graphically, as well as by campaign and to determine cost-per-acquisition (CPA) and conversion rate. We use the Number Datablock to track contact conversion rate month-over-month, alongside four other Number Datablocks containing HubSpot contacts, HubSpot MQLs, HubSpot SQLs and contact CPA.”
“This gives us a better picture of where leads drop out of the funnel.”
6. Impressions by Campaign
“Impressions by campaign” in Google Ads is the total number of impressions segmented by each campaign you have running.
This might be helpful to look at in order to determine which subjects and keywords have the volume and ad inventory necessary for you to generate results.
Related: How to Use Google Keyword Planner to Research & Target the Right Keywords
Recommended Datablock
To track impressions by campaign in Databox, Havenridge recommends the Account Overview Datablock with comparisons turned on:

“In order to understand which campaigns are being seen the most, we use the information from this Table Datablock alongside the total impressions data (with the same time frame) in the Account Overview block. We set our blocks to ‘last month’ for EOM reviews, and ‘month to date’ throughout the month to track live data.”
7. CTR by Ad Groups
An ad group in Google Ads is a group of ads that are targeting a shared set of keywords. “CTR by ad group” is simply the click-through-rate of each of your ad groups.
Recommended Datablock
To track CTR by ad groups in Databox, Havenridge recommends the Table Datablock:

“To really drill down into the data from our CTR by campaign, we look at our CTR by ad groups. While a campaign might be performing higher than any other campaign, you could still be pouring money into an ad group that is low-performing within that campaign.”
“The Table Datablock we use to look at CTR by ad groups helps us identify which ads our viewers are clicking.”
8. CTR by Campaigns
“CTR by campaigns” in Google Ads is the click-through rate, segmented by campaign, of any/all of your campaigns.
Monitoring CTR by campaigns will help you to see which campaigns, keywords, and/or ad groups are generating higher engagement.
Recommended Datablock
To track CTR by campaigns in Databox, Havenridge recommends the Table Datablock:
“We track CTR by campaign in a Table Datablock using a month-to-date timeframe so we can see live data on which campaigns are performing the best and actively move funds to support those campaigns. Another way we track CTR by campaign is in the Account Overview Table block.”
9. Cost Per Conversion
“Cost per conversion” in Google Ads is the average you’ve been charged for a conversion from your ad campaign. It’s calculated by dividing the total cost of conversions by the total number of conversions.
Remember, conversions are activities that you set in your Google Ads campaign that note important business activities, such as purchases, signups, etc.
Recommended Datablock
To track cost per conversion in Databox, Havenridge recommends the Number Datablock:
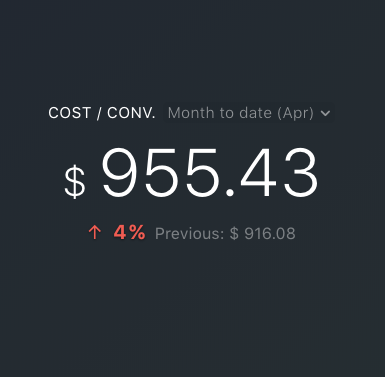
“Cost-per-conversion is critical data for us to see because it helps us project our future spending based on a goal number of conversions. It is so important that it gets its own dedicated number block with month-over-month data. We also feature cost per conversion in the Account Overview Datablock.”
10. Click-Through Rate (CTR)
“CTR” in Google Ads is the overall ratio of how often people who see your ad actually click your ad. It’s calculated by dividing the total number of clicks your ad receives by the total number of impressions.
Recommended Datablock
To track CTR in Databox, Havenridge recommends the Account Overview Datablock:

“Our first look at CTR is always in the Account Overview Datablock. Again, having a clean and easy-to-read overview of all important metrics gives us a quick glance into our campaign performance. We also like to view CTR data in a simple Number Datablock.”
Track All of Your Key Paid Search Metrics in One Place
Need an easier way to track the performance of your Google Ads? You can grab this free Google Ads dashboard to start visualizing your performance in minutes, building Google Ads reports for your own use or to share with your clients.
You can even pull paid search metrics from Bing Ads if you also run campaigns there—as well as KPIs from Facebook Ads, Twitter Ads, and LinkedIn Ads—to easily track all of your paid acquisition in one place.


