METRIC & KPI SOFTWARE FOR GROWING BUSINESSES
Track the metrics and KPIs that matter most
Empower your teams to monitor the metrics and KPIs they need, all in one place.

Trusted by 20,000+ growing businesses
Visualize your company’s most important metrics in one place
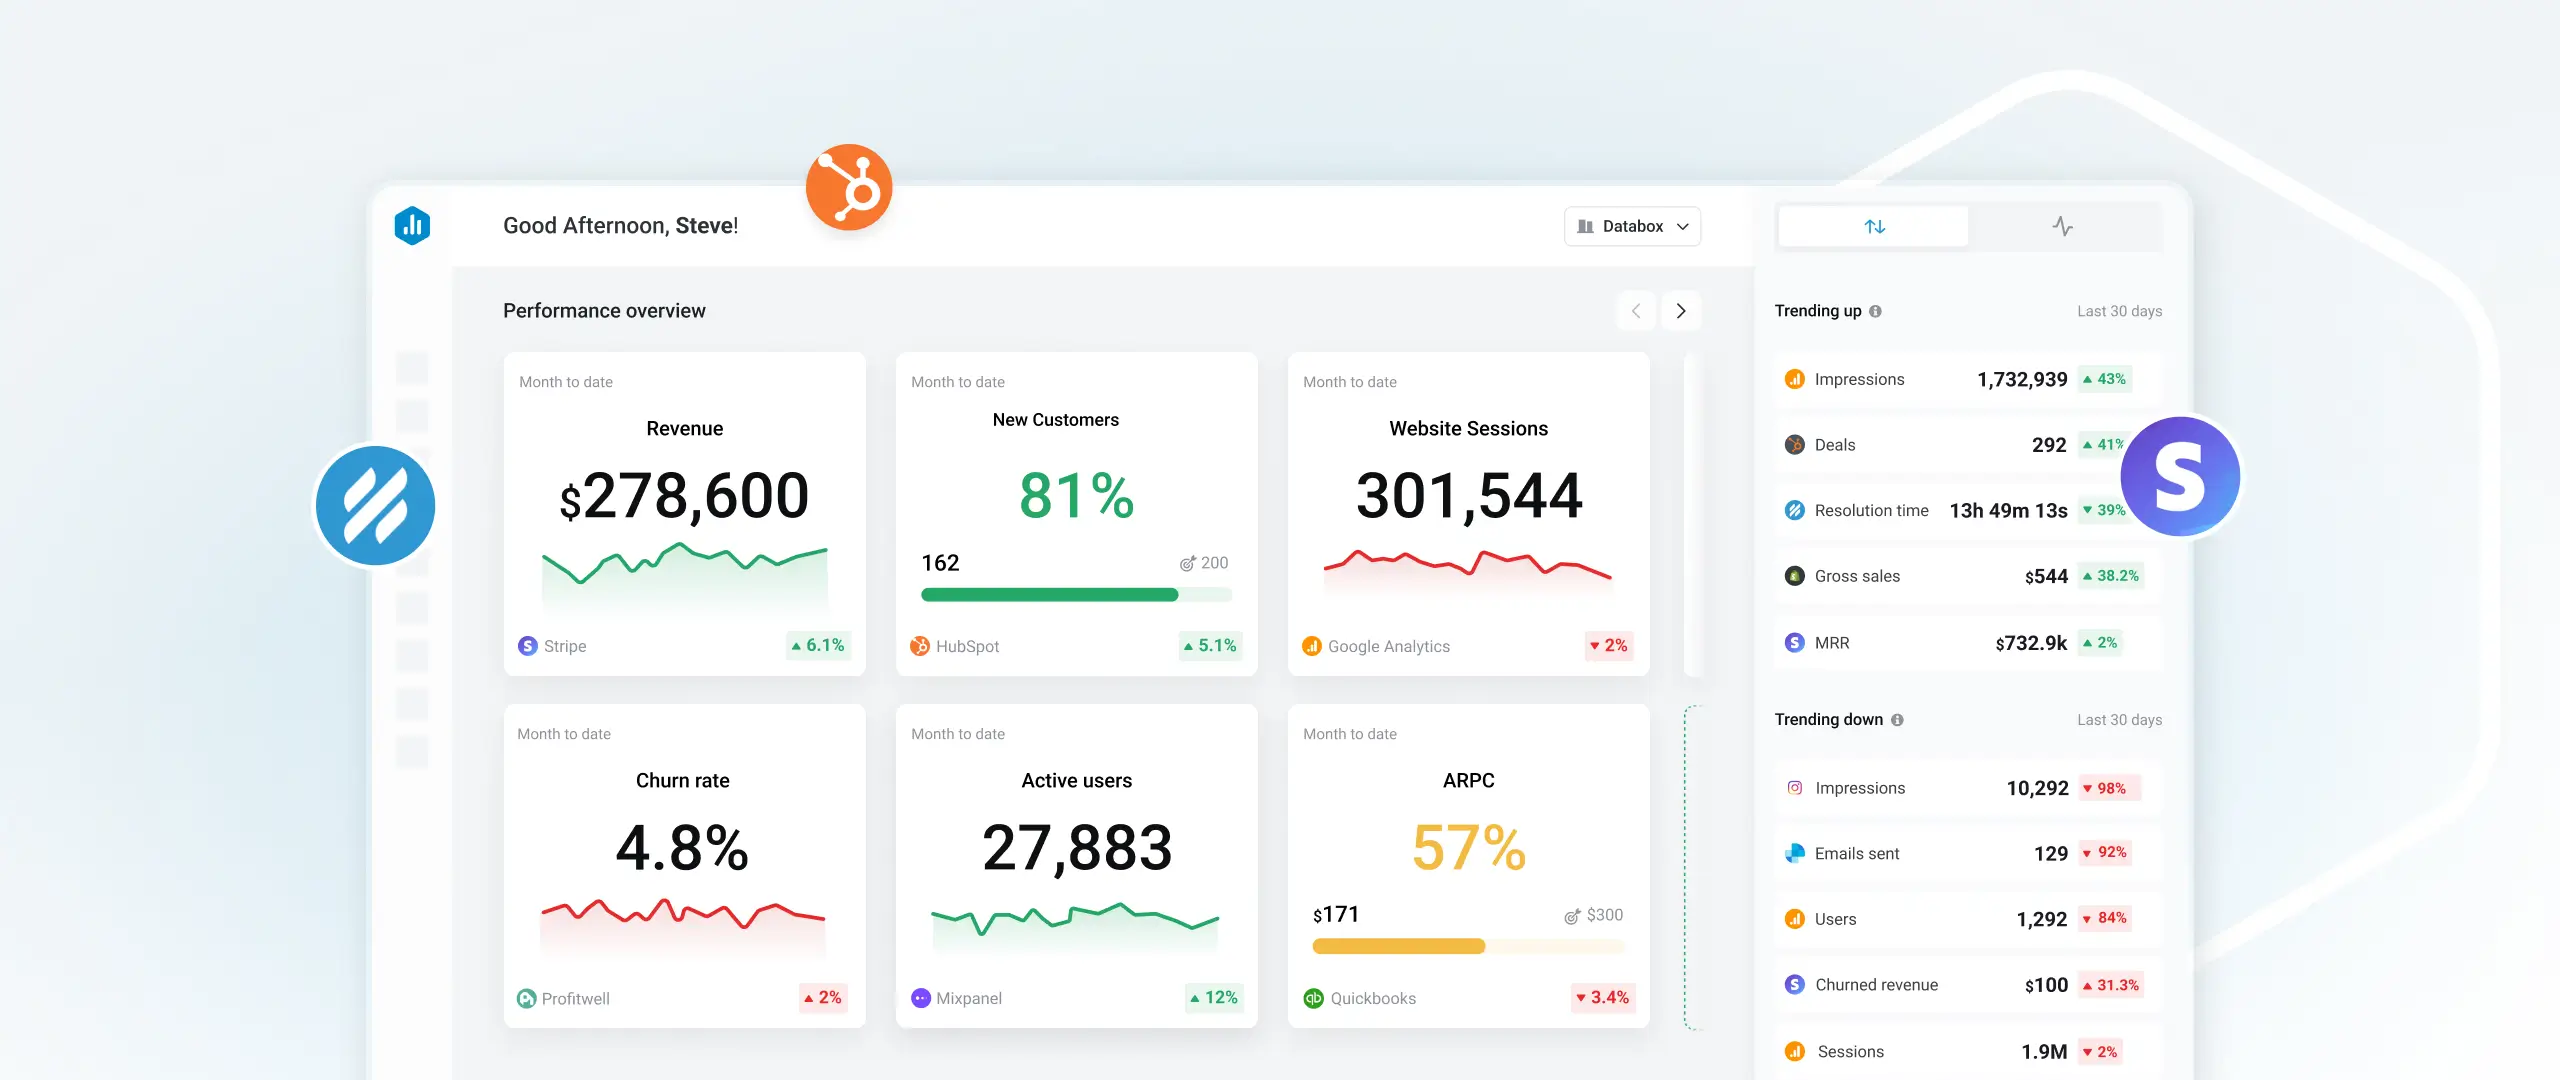
View the Metrics, Goals, Databoards, and Reports that matter most to you.
Get a summary of 10 metrics or goals you select, recently viewed dashboards or reports, and trending metrics, each time you log in.

Search thousands of pre-built metrics to track what you need
Search and find the metrics you need from 130+ integrations, then connect your account to start tracking them.

Build metrics from SQL (without knowing SQL)
Create custom metrics from your SQL sources without writing a single line of query, so everyone on your team can analyze database data on their own.

Create custom metrics for select data sources
Save the exact version of the metric you need—apply filters, add segments, and select multiple dimensions. Create it once, then explore it from multiple angles.

Track KPIs that require data from multiple sources
Combine metrics from data sources in an equation to create a new calculated metric, like Conversion Rates, ROI, ROAS, and more.

Answer, "How are we doing?" in seconds
Get a summary of your performance generated automatically by AI, so you always know how you're progressing.

Connect a custom API integration to Databox
Use our wizard to build Custom Metrics via API faster and easier, or do it manually.
Find all your metrics in one place

-
View metric definitions & examples
-
Connect each metric in seconds
-
Invite a teammate to connect
Other Features
Get more out of your metric & KPI tool


Powerful or and accessible
We took the best tools normally found in complicated enterprise analytics platforms, and made them accessible and easy to use for growing businesses.
Why Choose DataboxCustomer stories
Learn how other growing businesses are using dashboards to inform decisions, create plans, and drive growth.


Frequently asked questions
What are Basic Metrics in Databox?
Basic Metrics refer to the metrics that are available by default in Databox. They’re ready-to-use and require no additional setup. You can use Basic Metrics to quickly access and report on data from different Data Sources.
Can I create calculations using data from different sources?
Yes!
With the Data Calculations tool, you can combine data from multiple Data Sources into custom equations. The metrics created using this tool are known as Calculated Metrics in Databox. For example, you can leverage Data Calculations to create metrics like conversion rates, Return On Investment (ROI), Return On Ad Spend (ROAS), and more.
Is there a way to filter or segment my data?
Yes, depending on the Data Source.
With the Metric Builder tool, you have the ability to add dimensions, segments, and advanced filters to your data. The metrics created using this tool are known as Custom Metrics in Databox. Popular use cases include creating campaign-specific metrics, reporting on HubSpot Smart Lists, tracking custom conversions, and more.
Currently, the Metric Builder is available for 32 native integrations.
Where can I find a description/definition for each metric?
You can find a list of all our metrics, as well as their definitions, troubleshooting guides and help articles, in the Metric Library.
How can I use the Performance Screen?
The Performance Screen allows you to easily monitor and access the metrics, Goals, Dashboards, and Reports that matter most to you.
As soon as you log in to Databox, you can quickly see how your top metrics and goals are performing, easily access your dashboards and reports, and gain instant insights into your top-performing and underperforming metrics.
The Performance Screen is personalized for each user, tailored to the individual’s preferences and priorities.
Can I include metrics from multiple sources in a Scorecard?
Yes. Our KPI tool lets you include up to 15 metrics on a single Scorecard. If you wanted, each metric could be from a different data source.
Explore other tools in the platform
Track your first metric in 5 minutes or less
Compare
Databox Inc.
HQ: Boston, MA, USA
AI-powered analytics for teams that need answers now.
Databox Inc.
HQ: Boston, MA, USA

AI-powered analytics for teams that need answers now.


Compare