
4.5 out of 5 stars

2024 High Performer on
G2 for Marketing Analytics
4.8 out of 5 stars
The Only Marketing Dashboard Software That’s Free & Easy to Set Up
An all-in-one analytics marketing dashboard tool empowering you with real-time performance visualization at your fingertips.
Try it Free for 14 DaysBook a Demo


How to Build a Marketing Dashboard
Databox integrates with 100+ of the most popular software tools that companies use to track marketing performance. We call these data sources. Connecting your first data source is easy––just choose the tool you’d like to pull data from, select the kpis or metrics you’d like to include in your dashboard, and you’re ready to visualize your data and customize as needed.
Drag and drop your key marketing metrics directly into your dashboard, and watch as they automatically populate with your data and chosen visualization type. Easily resize and rearrange your datablocks (KPI visualizations), integrate metrics from other data sources—including CRM systems—and track all of your marketing performance metrics from any source in one centralized platform.

Eliminate manual reporting with our marketing dashboard software. Once you’ve built your custom marketing dashboard, you can schedule automated snapshots to be emailed to your team members on any day and time you choose. Automate real-time notifications directly in Slack, or simply share a secure link to provide your team with instant access to up-to-date marketing insights. With our marketing reporting software, collaboration and alignment have never been easier.
Databox integrates with 100+ of the most popular software tools that companies use to track marketing performance. We call these data sources. Connecting your first data source is easy––just choose the tool you’d like to pull data from, select the kpis or metrics you’d like to include in your dashboard, and you’re ready to visualize your data and customize as needed.
Drag and drop your key marketing metrics directly into your dashboard, and watch as they automatically populate with your data and chosen visualization type. Easily resize and rearrange your datablocks (KPI visualizations), integrate metrics from other data sources—including CRM systems—and track all of your marketing performance metrics from any source in one centralized platform.
Eliminate manual reporting with our marketing dashboard software. Once you’ve built your custom marketing dashboard, you can schedule automated snapshots to be emailed to your team members on any day and time you choose. Automate real-time notifications directly in Slack, or simply share a secure link to provide your team with instant access to up-to-date marketing insights. With our marketing reporting software, collaboration and alignment have never been easier.

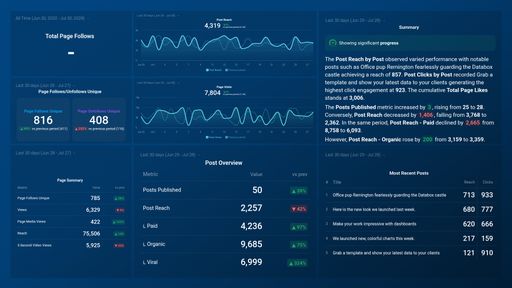
Get a High-Level View of Your Marketing Strategy
Build high-level marketing dashboards so the whole team is aware of how things are trending. Track and visualize key marketing metrics like Sessions, Sessions by Source, and Sessions by Social Channel to see how people are finding you. Track new leads or signups and also leads by channel so you can optimize for the right activities, and more. See which websites refer the most traffic, which pages on your website convert the most leads, and other important high-level trends that help inform strategy.
Try it Free for 14 Days
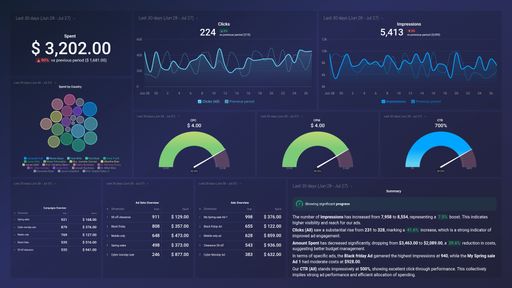
Drill Down Into Specific Marketing Campaigns or Initiatives
Databox is a custom marketing dashboard software—every marketing dashboard can go as macro or micro as you’d like. Get a glimpse of your ad campaigns across all of your paid traffic channels to see which are converting the most customers, or drill down into an individual ad to measure the cost-per-click, total amount spent, and revenue generated. Build a digital marketing dashboard to track traffic, leads, and sales by blog post, track email open rates by campaign, and see which social media channels drive the most traffic and leads.
Try it Free for 14 Days
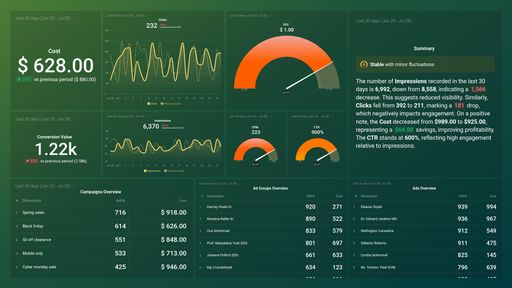
Align Sales and Marketing
Connect your CRM alongside your marketing data to connect the dots and draw correlation between the activities that actually drive leads and sales. Visualize your entire funnel from visitor all the way down to the sale so you can identify areas of opportunity and optimization quickly. Sync your strategies for an even bigger revenue impact and share the wins that come in as one team.
Try it Free for 14 Days
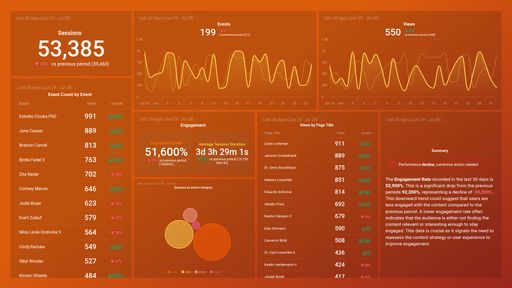
Report to Executives, Clients, or Investors
Send a beautiful and professional report in minutes. Choose from our design templates, use your brand colors, or add-on our white label option to your account. With a mobile app, Snapshots you can schedule, and high quality data visualizations, your VIPs can get the information they need at a glance.
Try it Free for 14 DaysWhat our customer say about us...
“Databox makes it so much easier. It’s so accessible that it’s not much of a problem for one person to manage.”
Andrew CampbellMarketing Analyst & Technology Manager at Harmon Brothers
“It gives such a great view on what’s happening with your audience, how do they react to things, what do people do on your website. Looking at all this data in one place is great.”
Anastasia HamelMarketing Manager for Deeplite
“Databox provides the ability to bring different pieces of marketing technology into a single view and to show a complete picture of how their business is performing.”
Paul SchmidtSmartBug Media

Build Your Marketing Dashboard with Our Library of One-Click Integrations
The easiest way to connect your data from different marketing channels with Databox is through any of our 100+ one-click integrations.
Explore 100 + Dashboard Integrations
Use Thousands of Pre-Built Marketing Metrics or Create Your Own
With Databox, you gain instant access to a vast library of thousands of pre-built marketing metrics. Simply drag and drop these metrics into your custom dashboard, and they will automatically populate with your data and chosen visualization type. Want to dive deeper? Take your marketing analytics to the next level by creating custom calculations that provide even more actionable insights for your marketing performance.
Ad Impressions
Number of times your ads were viewed during the specified date range.
Amount Spent by Ad Campaign
Estimated amount of money you’ve spent on your campaigns, ad set or ad during the specified date range split up by campaigns. Daily totals are not available for this metric. Instead, the total current value of this metric will be visualized cumulatively.
Website Engagement Rate
The percentage of sessions with active user interaction. An engaged session lasts over 10 seconds, includes at least two pageviews or screenviews, or involves a key event like a conversion.
Website Sessions
Number of Sessions during specified Date Range. A session is the period time a user is actively engaged with your website, app, etc.
Email Opens by Campaign
Total number of Opens split up by Campaigns. No historical data is available from before the initial connection.
Explore Hundreds of Pre-Built Marketing Dashboard Templates
Databox is the best marketing dashboard software because it comes with over 200+ pre-built marketing dashboard templates that can be set up in minutes. Effortlessly track and visualize your marketing performance metrics from tools like Google Analytics, Google Search Console, SEMrush, Ahrefs, HubSpot Marketing, and more—all in one centralized platform. Select any template, connect your data sources, and get instant visualizations of your key marketing KPIs in minutes.
What Else Can You Do With Databox?
Make your performance more predictable with Databox’s array of top-tier features that help marketers build dashboards, track performance, and report results with ease.

Dashboard Designer
No more fumbling around trying to visualize data in spreadsheets or slides. With our DIY Dashboard Designer, anyone can pull the metrics they need, visualize KPIs in a variety of ways, and build meaningful dashboards–no code or design skills necessary.

Calculated Metrics
With Data Calculations, you can combine data from multiple sources and easily calculate new metrics, KPIs, conversion rates, ROI, and much more — all without coding or spreadsheets.

Goal Tracker
Goals aren’t hit in a spreadsheet. With Databox, you can visualize your goals against current performance so you can make adjustments when they matter most.

Looped Dashboards
With amazing reporting features like Looped Dashboards, you can connect multiple dashboard reports together in one centralized report and easily share it with others.

Custom Metric Builder
Sometimes the preconfigured metrics from the tools you use aren’t enough. Use dimensions and filters to build custom metrics that allow you to pull more granular performance insights. With Query Builder, anyone can build the specific metrics they need without any engineering work.

TV Dashboards
Whether you’re viewing performance from your desktop, phone, TV, or even your wrist – Databox makes your data accessible no matter where you’re viewing it.
Start Building Your Marketing Dashboard
No more logging into dozens of different tools to understand performance — now you and your team can easily connect your data, build and share reports, monitor trends, and discover insights.
Try it Free for 14 DaysFrequently Asked Questions
Which software is best for dashboards?
We suggest our own Databox as a powerful dashboard software that simplifies data management with over 100+ one-click native integrations for top social media platforms and marketing tools. Easily connect your most-used data sources and access all your key metrics in one place—no more switching between tabs.
What is the best marketing dashboard?
While many sales and marketing tools include analytics features, Databox allows you to connect all of your favorite tools in one place, like Google Analytics, Hubspot Marketing, Semrush, and Wistia. Find out more about our native and third-party integrations.
Do you offer special Agency features?
We do. Features for agencies include client management, client performance monitoring, templated reports, annotation capabilities, alerts & notifications, and more. Find out more about agency features here.
What is a marketing dashboard?
A marketing dashboard helps you track performance metrics, individual and departmental KPIs, and report on your progress towards set goals. You can track just about anything using a great dashboard technology marketing toolkit like Databox:
- SEO performance
- PPC performance
- Social media
- Email marketing
- Content marketing
- Marketing automation
- Video marketing
- Web analytics
- Lead generation
- Paid ads
- Paid search
Want a head start? Databox has 200+ free marketing dashboard examples and templates that come pre-built with some of the most commonly tracked metrics from the most popular tools. Customize your templates at any time. Check them out and create your Databox account to get started.
What are marketing KPIs, and how can I track them with a dashboard?
Marketing KPIs (Key Performance Indicators) are quantifiable metrics that reflect the success of your marketing efforts, such as conversion rates, customer acquisition costs, and click-through rates. With Databox, you can easily track these KPIs in real-time by adding them to your customizable dashboard.
How does marketing dashboard software help in analytics?
Marketing dashboard software aggregates data from various sources, providing real-time analytics and visualizations. This helps you identify patterns, track campaign performance, and gain actionable insights to enhance your marketing strategies.
How do I create a marketing dashboard?
To create a marketing dashboard in Databox, start by selecting your desired integration from the Data Sources menu and log in to connect it. Then, simply drag and drop the metrics you need into your dashboard, and they’ll automatically populate with your data in the chosen visualization format. You can easily resize and rearrange datablocks, add metrics from additional data sources, and track all your marketing metrics in one unified dashboard.
Which Marketing data source integrations do you support?
We have 100+ one-click integrations, including: Google Analytics, ActiveCampaign, Hubspot Marketing, and Shopify. Find out more about our native and third-party integrations.
How do I build a Marketing scorecard or report?
Databox Scorecards send you updates on your key performance indicators (KPIs) through email, mobile push notification, and/or Slack every day, week, or month. We also support scheduled Snapshots, embedding your databoards, Looped databoards, and offer white-labeling.


GDPR
compliant
compliant
certified