Uses one-click integrations:
-
 Jira
Jira
If you don't use Jira, you can pull data from any of our 130+ one-click, native integrations or from spreadsheets, databases and other APIs.
Try this dashboard for freeWhat you’ll learn from this Jira Dashboard template
With this Jira dashboard template you’ll be able to monitor key aspects of your software development process, as well as measure your team’s productivity and performance. By connecting your Jira account, you’ll be able to report on:
- How do I track the Issue status in Jira? Track your project’s workflow and see how many issues are at a particular stage of the life cycle, that will enable you to assess your team’s progress towards your goals.
- How do I view completed tasks in Jira? View all project tasks that have been completed in a given month and the estimated size and relative value of that task.
- How do I know who completed specific tasks in Jira? See who completed a specific project task and how long the team mate estimated it will take and the relative value of the completed task.
- How do I see how many issues have been resolved? View the total number of issues that have been resolved and are awaiting verification at any given time. See how this data compares to the number of issues resolved in the previou month.
- How do I track my team’s response time to issues? Monitor how many issues have been created by users in the current month regarding software bugs, a user requirement, or a leave request form and how many of those issues have been resolved. Does it take a longer time to resolve some issues? Why so?
Pull additional data using our robust integration with Jira.
What other campaign metrics can you track and visualize with our integration with Jira? Almost anything:
- Velocity
- Sprint burndow
- Control chart
- Cumulative flow
- Defects
In Databox there are dozens of Jira metrics already built and ready for you to visualize in a variety of different ways. With the use of Query Builder and Data Calculations, the range of different metrics and metric combinations you can track from Jira widens.
Read more about Databox’s Jira integration.
Jira metrics included in this template
- Issues resolved
-
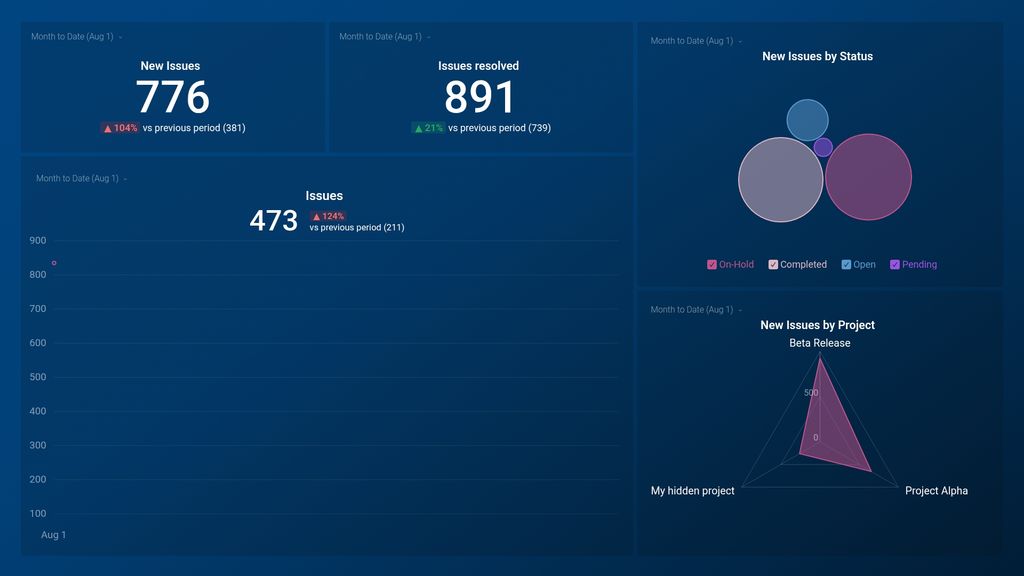
New Issues
The New Issues metric in Jira represents the number of recently created issues within a specific timeframe. It serves as an indicator of project activity and helps measure team productivity.
-
New Issues by Project
The New Issues by Project metric displays the number of new issues created across all projects in Jira within a specified timeframe.
-
New Issues by Status
The New Issues by Status metric tracks the number of newly created Jira issues based on their current status. It provides insight into the workflow and efficiency of the issue resolution process.
-
Issues
The Issues metric in Jira represents the number of active tasks or projects that require attention and can track progress and workflow within a team or organization.