


Table of contents
The reasons for writing business Reports are pretty compelling. Without them, you can’t have a complete overview of any past periods to evaluate your performance, fix mistakes, and replicate strategies that helped you achieve your goals.
Moreover, you get to plan for the future and create an actionable plan based on the data you collected and presented in a report.
In fact, recent research by Databox found that regular business reporting leads to an improved ability to plan future investments and make strategic decisions for most companies.
However, with so many types of reports in business, you may be unsure of when to use each type, and you can’t afford to waste your time and other resources on wrong solutions that don’t drive business growth.
This comprehensive guide will help you understand each type of report in business and the best use for them.
- What Are Business Reports?
- How to Write a Business Report?
- 24 Types of Business Reports You Should Know About
- Business Report Examples
- Databox Offers Types Of Reporting For Every Business & Purpose

What Are Business Reports?
Business reports are informative documents containing important data about your business, such as different figures, research findings, and analyses, with the purpose of providing streamlined, digestible information to everyone involved in the business decision making process. Business reports provide you with deeper insight into your business, so you can:
- Examine potential issues
- Make data-driven conclusions
- Identify growth opportunities
- Reevaluate your goals and set new ones
- Maintain transparent communication with the stakeholders
The author of the report presents the data related to business goals, so you can evaluate where you stand in terms of the progress toward goals. Whether the progress is satisfactory or not, the key is to create a list of actionable items at the end of the report, so everyone involved (both managers and employees) know what to do next and how to adjust your strategy to improve your progress.
Another purpose of writing reports is to facilitate and streamline the communication between the person writing the report and those who read it.
A high-quality business report should be:
- Concise
- Well-structured
- Objective
- Data-driven
- Actionable
How to Write a Business Report?
Business reports usually follow a particular structure, as they contain specific elements, such as a table of contents, data visualizations, and sometimes additional documentation at the end.
Here’s the process that represents the best practice in writing business reports.
Before writing the report, collect all the documentation you may need and choose appropriate data visualization tools to use in the report. Create an outline and identify any formatting guidelines your company may require. Select the app or program in which you’re going to write, typically Microsoft Word or Google Docs.
When you start writing, pay attention to all the relevant elements of the report. The title should be engaging, the introduction should provide information on the report background and goals, while the report body should be divided into clear, logical sections.
Your conclusion should be effective and contain actionable items or recommendations that follow your assessments. When you’re done with the body of the report, write the summary and place it at the top of the report. Before submitting or printing the final version, make sure you proofread your work to eliminate errors.
PRO TIP: How Well Are Your Marketing KPIs Performing?
Like most marketers and marketing managers, you want to know how your efforts are translating into results each month. How is your website performing? How well are you converting traffic into leads and customers? Which marketing channels are performing best? How does organic search compare to paid campaigns and to previous months? You might have to scramble to put all of this together in a single report, but now you can have it all at your fingertips in a single Databox dashboard.
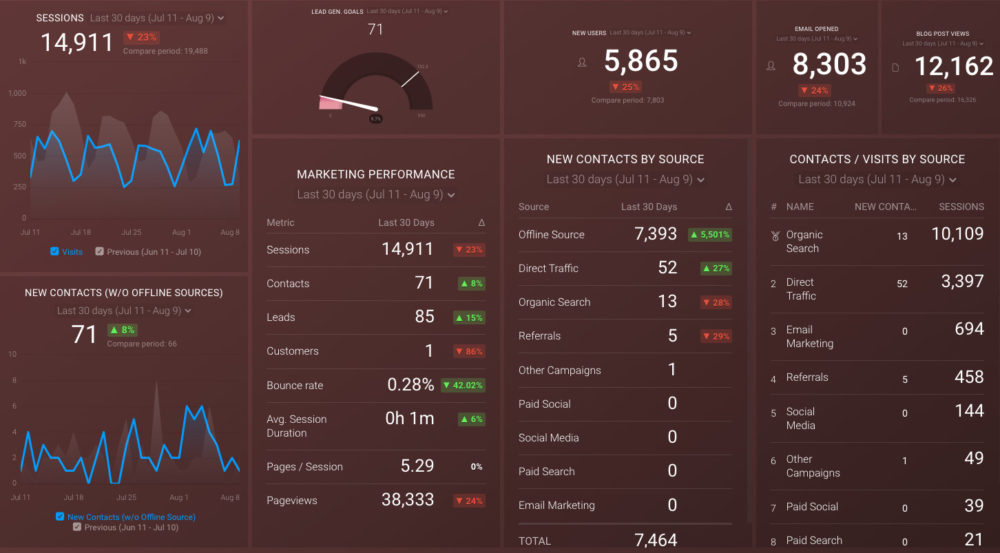
Our Monthly Marketing Performance Dashboard includes data from Google Analytics 4 and HubSpot Marketing with key performance metrics like:
- Website sessions, new users, and new leads. Basic engagement data from your website. How much traffic? How many new visitors? How many lead conversions?
- Lead generation vs goal. Did you reach your goal for lead conversion for the month, quarter, or year? If not, by how much did you miss?
- Overall marketing performance. A summary list of the main KPIs for your website: sessions, contacts, leads, customers, bounce rate, avg. session duration, pages/session, and pageviews.
- Email response. Overall, how effective were your email campaigns, measured by email opens?
- Blog post traffic. How much traffic did your blog attract during a certain period?
- New contacts by source. Which sources drove the highest number of new contacts
- Visits and contacts by source. How did your sources compare by both sessions and new contacts in a certain period of time?
Now you can benefit from the experience of our Google Analytics and HubSpot Marketing experts, who have put together a plug-and-play Databox template that contains all the essential metrics for monitoring and analyzing your website traffic and its sources, lead generation, and more. It’s simple to implement and start using as a standalone dashboard or in marketing reports!
You can easily set it up in just a few clicks – no coding required.
To set up the dashboard, follow these 3 simple steps:
Step 1: Get the template
Step 2: Connect your HubSpot and Google Analytics 4 accounts with Databox.
Step 3: Watch your dashboard populate in seconds.
24 Types of Business Reports You Should Know About
To fully leverage the value of reports in business, you need to know when to use which. In this section, you’ll find over 20 types of business reports–learn what each of them means and when you’re supposed to use them.
- Ad-Hoc Committee Report
- Analytical Report
- Annual Report
- Explanatory Report
- External Report
- Fact-Finding Business Report
- Formal Business Report
- Industry Report
- Informal Business Report
- Informative Business Report
- Internal Report
- Majority Report
- Minority Report
- Operational Report
- Performance Report
- Problem Solving Business Report
- Product Report
- Progress Report
- Research Report
- Standing Committee Report
- Summarized Business Report
- Technical Business Report
- Verbatim Business Report
- Vertical & Lateral Report
Ad-Hoc Committee Report
Also called Special committee reports, ad-hoc committee reports are created for specific purposes and situations that don’t normally happen at the company–unexpected issues or accidents. For example, if an employee gets injured at the workplace, so the situation must be assessed and solved immediately.
The report is created for the situation investigation purposes only, and the committee is dismissed as soon as you present the report.
Analytical Report
Sometimes referred to as interpretative business reports, analytical reports present you with information regarding a specific event that occurred in the business. For example, there can be a huge drop or increase in website traffic, so the analytical report would investigate the causes of the event.
Analytical reports also contain opinions on the situation and recommendations on the further course of action.
Annual Report
Annual reports are created once a year and are usually presented to the executives and shareholders. They contain relevant information about the company’s financial performance: sales profits and turnovers.
Annual reports are extremely important because the corporate heads make decisions about budgets for different departments, investments, etc. based on these reports. If there’s a pre-decided plan or a strategy, it can be changed based on the findings and figures presented in the annual report.
Explanatory Report
Explanatory reports serve to explain a specific topic to other team members who need to understand it. For example, it may be certain research that you’ve conducted or a project that you’ve worked on.
In this report, you need to present your goals, methodology, findings, and recommendations for further steps. Writing explanatory reports should be particularly clear and concise so even those who weren’t involved in the project can understand it.
External Report
External reports are usually financial reports that are meant for an audience outside of your business. The term, however, refers to any type of report you create with the goal of presenting it to the general public.
Fact-Finding Business Report
Fact-finding reports are written in situations when it’s necessary to identify a fact about an event and identify who should assume responsibility or whose solution is more appropriate. For example, if a machine breaks down in a factory, a fact-finding report must be created with the goal to identify why it happened.
The author of this report is usually a third person, so it can be objective, and it’s presented to the company executives.
Formal Business Report
Formal business reports need to follow a specific format and procedures, and there’s little room for personalization. They’re presented to a competent authority, usually department heads or the top management of other companies.
Formal reports usually contain data analysis, conclusions, and recommendations, presented in a formal and previously established manner, which is why they’re called formal.
Industry Report
Industry reports provide in-depth information about a specific industry, market, or a sector in a region.
The typical elements industry reports include are: concept definitions, trends, outlooks, industry size and value, industry leaders, competitive landscape, facts, statistics, and more. Companies use this industry analysis to assess their market and understand how their industry is changing, so they can remain competitive.
Informal Business Report
Informal business reports are typically used internally and you have more freedom when creating them. They don’t need to follow strict formatting guidelines. Sometimes, they may even have the form of a business letter.
It’s important to remember that you should create informal business reports in a way that’s convenient both for you and the person who’ll read the report, especially as it should be presented to the requester immediately upon their request.
Informative Business Report
Informational business reports contain objective information on an issue. They may contain facts and data, but not analysis or explanations. They also don’t predict possible outcomes or give recommendations for future action, as they should be non-biased.
Informational reports are supposed to be as detailed as possible as they allow authorities to make informed decisions based on the data presented.
Internal Report
Unlike external reports, internal reports are only meant for the people inside your organization. They sometimes contain confidential information about the company that’s not supposed to be shared with third parties.
Internal reports may be created frequently, and can contain all types of information: financial, operational, marketing, sales, etc. Their purpose is to help teams optimize their operations and performance based on these reports.
Related: Internal vs. External Reporting: What Are the Differences?
Majority Report
Majority report is created when a decision within a committee isn’t made unanimously. In this case, the majority creates a report and submits it to the responsible body.
If the whole committee, including the chairman, shares the same opinion, a single report is written instead of the majority report.
Minority Report
Minority reports are submitted by the dissenting members of a committee, when there’s a subcommittee appointed to make the final decision on a special subject.
If the three members, who make this subcommittee, can’t make a unanimous decision, they’re allowed to submit separate reports, despite representing a numerical minority.
Operational Report
An operational report represents a detailed, precisely formatted overview of a business’s operational activities, including production costs and processes, sales performance, and more.
The data in an operational report should be ready for analysis, so you can evaluate the efficiency of your operations and introduce changes where needed. Operational reports are often created frequently: weekly, daily, and sometimes even hourly, depending on the type of information they contain.
Performance Report
Performance reports are created for each department in the company and presented to the top management or shareholders. Sometimes, team leaders also create performance reports for individual employees, especially if the employee is new or they might be eligible for a promotion.
These reports measure a department’s or an employee’s overall success and helps the top management make further decisions. Performance reports are also used for evaluating projects and products.
Related: SaaS Reporting: How Performance Reports Helped SaaS Businesses in Improving Key Processes
Problem Solving Business Report
When a problem arises in a team, department, or organization, employees may be required to create a problem-solving report. The role of this report is to outline the problem and present potential solutions.
To write this report, you need to collect all relevant information and recommend a plan of action that will lead to problem resolution. Sometimes, problem-solving reports also include an analysis of problem causes, so that you can prevent such issues in the future.
Product Report
Product reports are usually presented to the company’s management and outline the key data regarding the product that your business sells. Typically, they include sales, net and gross revenues, discounts, inventory data, and more.
Depending on the product report goal, you may also include research of competitors’ products or detailed findings from testing your own product. Note that you may also present a product report to other employees when necessary–the audience determines the exact format of the report.
Progress Report
Progress reports are created with the goal of letting others know how a project, research, or something else is going. These reports are meant to be simple updates on the stage you’re currently at rather than being too detailed an analysis containing tons of data.
You can create progress reports weekly, bi-weekly, or monthly, depending on the size of the project. Sometimes, you can also include the plans for the upcoming period.
Related: Find out how experts we surveyed use progress reports to motivate their teams, promote inter-departmental coordination, take better decisions, and much more.
Research Report
Research reports help you introduce changes to your business, marketing strategy, partnerships, or add new products or services to your offering. From these reports, your team members can understand why this change is happening and how.
A research report presents an overview of all the relevant data regarding the change. For example, if you’re introducing a new product, you may include a target market analysis or a competitor analysis and statistics to corroborate your actions.
Related: What is a Marketing Research Report and How to Write It?
Standing Committee Report
A standing committee report is a report created by a committee that’s been put together for a specific purpose. A standing committee, unlike an ad-hoc committee, is set up permanently and isn’t dismissed after the report is created.
Standing committee may oversee a specific department’s performance or the company’s overall financial performance and report on it on a regular basis.
Summarized Business Reports
Also called a summary report, a summarized business report only contains the essential details of a project, business meeting, etc.
These types of reports in business are shorter versions of long business reports that have a specific audience: the press, top management, shareholders. The goal is to allow the reader to get familiar with the report subject quickly, without having to go through all the material.
Related: How to Write an Executive Summary for a Report: Step By Step Guide with Examples
Technical Business Reports
Technical reports are used to inform the company members about a change that the company is introducing to the technology it uses. For example, a business may decide to introduce a new mechanical process or automation instead of doing something manually.
Technical reports include a detailed overview of the technology being introduced, which resources the company will need to implement it (and how much of them), and more. This detailed assessment helps the management make a final decision on this change.
Verbatim Business Reports
Verbatim reports are word-to-word conversations recorded in a business meeting. It’s usually a secretary’s job to create verbatim reports. These reports can be used in voting meetings or when there’s a resolution of auditor appointments.
It’s important to make a distinction between verbatim reports and meeting minutes. The latter represents a summary of a meeting, including the decisions made, but it doesn’t need to be in the exact wording used during the meeting.
Vertical & Lateral Reports
Whether a report is vertical or lateral depends on who you report to.
Vertical reports are created either for your managers or your subordinates: these reports move up or down in the company hierarchy, depending on their goal.
On the other hand, lateral reports are created for your team or another team in your organization that’s on the same level. For example, marketing and sales departments may create lateral reports to coordinate their activities.
Business Report Examples
Any type of business report is more streamlined and easier to understand and act on when you include appropriate data visualizations. In this section, we’ll give you examples of different types of reports, presented through dashboards containing all relevant metrics and data.
- Monthly Marketing Report Example
- Sales Overview Report Example
- Social Media Overview Report Example
- Email Marketing Performance Report Example
- Financial Report Example
- Ecommerce Overview Report Example
- SEO Overview Report Example
- Annual Report Example
- Customer Success Overview Report Example
- SaaS Revenue Trends Report Example
Monthly Marketing Report Example
The HubSpot Marketing Monthly Reporting dashboard includes all the relevant KPIs and metrics a marketer needs to track during a month. This dashboard allows you to answer important questions about your marketing performance, such as: where your website traffic comes from, if your landing pages are performing well and bringing conversions, blogging and email performance, and more.

Available metrics:
- Website visits by source
- Landing page performance
- Blogging performance
- Conversions
- Visits from socials, etc.
Sales Overview Report Example
The Sales Overview dashboard provides you with a streamlined overview of your sales team’s performance. This dashboard helps you track your sales pipeline and progress toward your goals, while keeping an eye on the critical metrics and team leaderboard. You get to learn which team members have the best performance, see your whole sales funnel, have a high-level overview of your team’s KPIs, and more.

Available metrics:
- All deals
- Average time to close deal
- Number of calls logged
- Number of companies created
- Closed won by owner, and more
Social Media Overview Report Example
The Social Networks (Growth & Engagement) dashboard template is a streamlined way to track and manage your performance on top social media platforms, such as Facebook, Twitter, Instagram, LinkedIn. It allows you to measure your success and stay on top of your follower count, likes, views, engagement, and more, so you can adjust your strategy and content to resonate with your audience and reach more people.

Available metrics:
- CPM, CPC, CPL
- ROAS
- Engagement rate
- Unique views
- Impressions, and more
Email Marketing Performance Report Example
The HubSpot Email Marketing Performance dashboard allows you to monitor your email marketing efforts in a simple manner and adjust your strategy accordingly. Even if you don’t use HubSpot Marketing, this dashboard allows you to pull the data from other integrations. You get to track the health of your email database, how your subject lines are performing, gauge campaigns’ performance, and more.

Available metrics:
- Click through to open rate (CTOR)
- Open rate
- New contacts without offline sources
- Emails sent
- Emails clicked by email campaign, and more
Financial Report Example
The QuickBooks + HubSpot CRM Financial Performance dashboard helps you monitor your business’s overall financial health and identify any issues that may negatively impact your cash flow and turnover. The dashboard enables you to track open invoices and expenses in QuickBooks, identify how much you earned from paid invoices, measure the company’s earnings, and more.

Available metrics:
- Gross profit margin
- Open deals amount by stage by pipeline
- Paid invoices amount
- Open invoices by customer
- Deal amount by stage by create date
Ecommerce Overview Report Example
The Google Analytics Ecommerce Overview dashboard provides you with complete insight into your online store’s performance. By monitoring the data in the dashboard, you can learn more about the store’s transactions and revenue, and answer questions such as how much you generate in sales, how many visits your ecommerce store has, how many visitors convert, what your best-selling products are, and more.

Available metrics:
- Average order value
- Sessions
- Revenue per visit
- Revenue by channel
- E-commerce conversion rate, etc.
SEO Overview Report Example
The SEO Overview dashboard helps you track your SEO performance and monitor keyword rankings, inbound links, ranking distribution, and more. You get to answer important questions regarding your SEO efforts, like: whether your website generates high authority backlinks, what your domain authority is, whether your website is SEO friendly, what keywords rank the best, and more.

Available metrics:
- Organic sessions
- Organic goal competitions
- Clicks by queries
- CTR
- Position
Annual Report Example
The HubSpot Annual Inbound Performance dashboard gives you a complete overview of sales, email, traffic, contacts, and more for the whole year. With this dashboard, you can learn which of your channels drive the most top of the funnel growth, which blog posts are read and shared more than others, which landing pages are the most successful in terms of capturing new contacts, and so much more.

Available metrics:
- Email performance
- New contacts by source
- Sessions
- New online contacts
- Top blog posts by page views
Customer Success Overview Report Example
The Customer Success Overview dashboard helps you track your customer service performance and identify correlations between customer service team’s metrics and churn rate. You can easily learn about your monthly recurring revenue from new customers, the number of refunds and cancellations in a specific month, the number of customers that needed help on a daily basis, and more.

Available metrics:
- New customers
- Revenue churn
- New MRR
- Customer satisfaction score
- Interactions per resolution, etc.
SaaS Revenue Trends Report Example
With the SaaS Revenue Trends dashboard, you can easily track all the relevant SaaS KPIs in real-time and see how much your company has grown over the year. This dashboard allows you to identify your weakest and strongest months so you can replicate successful strategies that drive revenue, and learn which tactics didn’t bring you the desired results.

Available metrics:
- Customer changes
- Recurring revenue
- New recurring revenue
- Churn by type
- MRR changes by type
Emerging Trends in Business Reporting
1. AI-Driven Analytics and Automated Report Creation
Artificial intelligence (AI) has become increasingly accessible and can now handle many of the data-heavy tasks that once consumed hours of manual work. By using AI-driven analytics, you can automatically collect, process, and interpret data from multiple sources and generate detailed reports with minimal human intervention. This not only saves time but also reduces the risk of error from manual data entry or complex spreadsheet calculations.
Additionally, AI-powered tools can help you spot patterns or anomalies in real time—for example, unexpected spikes in website traffic or revenue trends that deviate from your forecast. By receiving instant notifications when these events occur, you can make timely decisions and optimize your strategy more efficiently.
2. Data Governance and Privacy Considerations
With stricter data protection regulations like GDPR (General Data Protection Regulation) in the EU and CCPA (California Consumer Privacy Act) in the US, businesses must pay closer attention to how they collect, store, and use customer information. This extends to how you compile and present that data in reports.
When preparing business reports, ensure that all personal data is either anonymized or properly consented to, and that you’re storing sensitive information in compliance with relevant regulations. Regular data audits, clear data retention policies, and transparent data-handling practices will not only help you avoid legal pitfalls but also build trust with customers, stakeholders, and employees.
3. Real-Time vs. Periodic Reporting
While periodic reporting (weekly, monthly, quarterly, or annually) remains essential for tracking long-term trends, real-time reporting is gaining traction as businesses strive to stay agile in fast-paced markets. With real-time dashboards, data from sales, marketing, finance, and operations can flow in continuously, providing immediate visibility into key performance metrics.
This allows teams to act on issues or opportunities as soon as they arise—rather than waiting for the next scheduled report. However, it’s important to strike a balance: too much real-time data can overwhelm decision-makers and distract from bigger strategic goals. Most companies use a hybrid approach, leveraging real-time dashboards for immediate insights while still relying on periodic reports to identify macro-level trends and analyze progress toward long-term objectives.
Databox Offers Types Of Reporting For Every Business & Purpose
Business reporting may take too much time, and the results may not always turn out the way you need them. A 30-page long report is difficult to go through, especially if you need to draw conclusions quickly and implement changes to your strategy as soon as possible or fix a pending issue.
But, there’s a way to improve your reporting process immensely. if you replace long, unstructured reports with easy-to-use, streamlined dashboards, you can quickly get to the data you need, connect multiple reports in one, and easily share it with your co-workers, clients, or managers.
Databox’s reporting software allows you to tell a story with your data, get important insights fast, and present your findings in a beautiful, clear way. Moreover, you only have to set up your dashboards once. Next time you need a report, the data will already be there, waiting for you to analyze it. This way, you can spend more time examining the data and building strategies to improve performance, and less time building reports and dashboards.
If your business needs such a resource-saver, wait no more and start your free trial Databox account today.


