Uses one-click integrations:
-
 Facebook Pages
-
 Instagram Business
-
 LinkedIn Company Pages
-
 X (Twitter)
If you don't use Facebook Pages, Instagram Business, LinkedIn Company Pages or X (Twitter), you can pull data from any of our 130+ one-click, native integrations or from spreadsheets, databases and other APIs.
Try this dashboard for freeWhat you’ll learn from this Social Networks (Growth & Engagement) Dashboard template
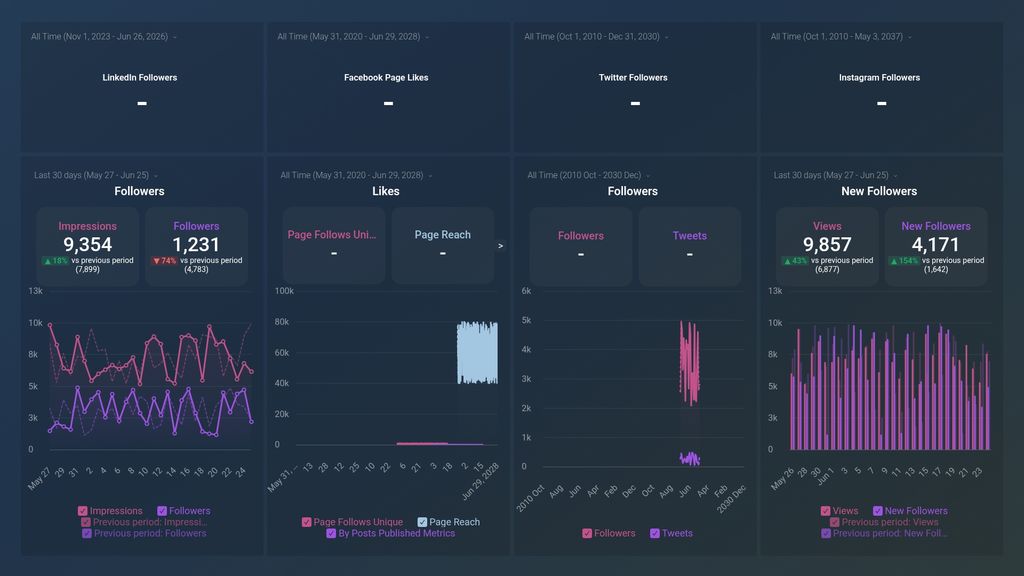
Measure and analyze engagement across all major social networks in real-time, including likes, views, followers count, and growth. Ramp up your social media marketing efforts by tracking:
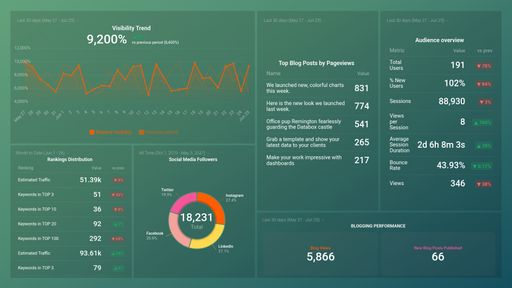
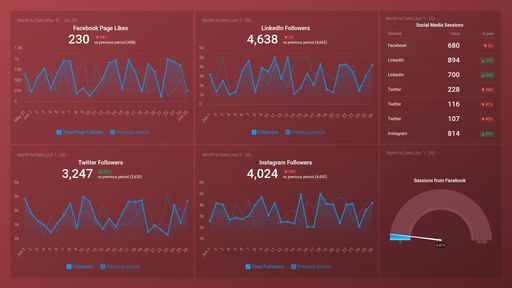
- How many people are following my company’s Linkedin page? View the total number of company page followers your account has at any given time. This metric is valuable as it is an indicator of the popularity, the likeability of your brand, and that your followers like your content enough to want to stay connected.
- How do I track my Twitter followers? See the number of Twitter followers your account has in real-time, as it is a good indicator of your brand’s popularity and the quality of your tweets (content), and how it resonates with your target groups.
- Can I track my Facebook page likes? View the total number of likes your Facebook page has amassed over a period of time.
- How do I track daily follower count on Linkedin? Track your company page follower count daily and see how many times your post was shown on someone’s timeline within a specified time period. Compare your follower count and impressions data for the current time period to the same time period the previous week/month/year. Are you gaining more followers? Are your posts being seen by more people? If not, find out why.
- How many new followers does my Instagram business account have? Keep track of the growth rate of your Instagram business account. View the total number of new followers your business has on Instagram in real-time and how the data for the current time period compares to the same time prior.
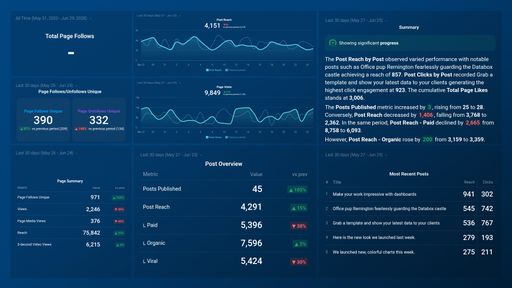
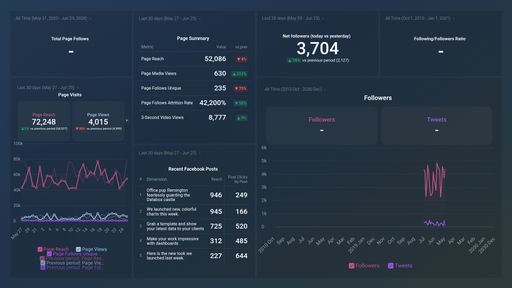
- How do I measure engagement on my Facebook page? Keep track of key engagement metrics for your Facebook page on a daily basis, including total page views, engagement (likes, comments, shares, and so on). Monitor how much content is being put out by your Facebook page daily. Tracking this metric is important. As you publish more quality content, your page stands to get a higher engagement rate and so much more.
Pull additional data using our deep integration with Facebook Pages
What other campaign metrics can you track and visualize with our integration with Facebook Ads? Almost anything:
- Individual campaign and ad performance
- Clicks, downloads, leads, and sales
- Cost per impression (CPM), click (CPC), and lead (CPL)
- Return on ad spend (ROAS)
- Ad spend and overall budget
- Progress towards your campaign goals, and more
In Databox, there are almost 100 Facebook Ads metrics already built and ready for you to visualize in a variety of different ways. With Query Builder and Data Calculations, the range of different metrics and metric combinations you can track from Facebook Ads widens.
Read more about Databox’s Facebook Pages integration.
Explore more X (Twitter) dashboards.
What other campaign metrics can you track and visualize with our integration with Linkedin company pages? Almost anything:
- LinkedIn ad performance
- Impressions, engagement, clicks, comments, and shares
- Follower demographics
- Pageviews and Unique views
- Progress towards your campaign goals, and more
In Databox, there are dozens of LinkedIn metrics already built and ready for you to visualize in a variety of different ways. With Query Builder and Data Calculations, the range of different metrics and metric combinations you can track from Linkedin company pages widens.
Read more about Databox's LinkedIn Company Pages integration.
What other campaign metrics can you track and visualize with our integration with Twitter? Almost anything:
- Twitter engagement rate
- Return On Investment
- Follower demographics
- Tweet performance
- Hashtag performance
- Follower demographics
In Databox, there are dozens of Twitter metrics already built and ready for you to visualize in a variety of different ways. With Data Calculations, the range of different metrics and metric combinations you can track from your Twitter account widens.
Read more about Databox's Twitter Company Pages integration.
What else can you track and visualize with our deep integration with Instagram business?
When it comes to traffic and conversions, almost anything
- Impressions and reach
- Account performance
- Follower growth and count
- Website and email clicks
- Profile visits
In Databox, there are dozens of Instagram metrics already built and ready for you to visualize in a variety of different ways. With Data Calculations, the range of different metrics and metric combinations you can track from Instagram Business account widens.
Read more about Databox's Instagram business integration.
Facebook Pages metrics included in this template
- Page Follows Unique
Instagram Business metrics included in this template
- Views