
Facebook and X (Twitter) Performance Overview Dashboard Template
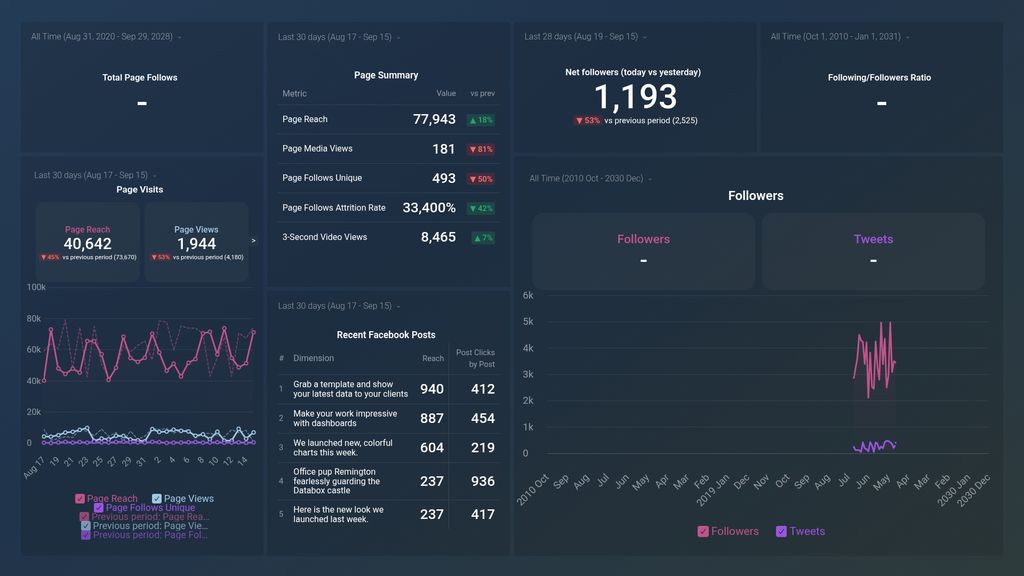
Monitor your social media performance with Databox's Facebook & X Performance Overview dashboard. Track key metrics like daily page views, follower counts, total engagement, and most popular posts to optimize your content strategy.
Pulls data from

Facebook Pages
Get metrics on new likes, posts reach and daily user engagement for your page.

X (Twitter)
X (Twitter) is a popular social media platform where users can share and discover information through short messages called tweets. With a limit of 280 characters per tweet, it fosters real-time conversations, facilitates global connections, and enables individuals, businesses, and public figures to engage with a wide audience. Users can follow others, retweet, like, and reply to tweets, creating a dynamic and interactive environment for news, trends, opinions, and networking.
If you don't use Facebook Pages or X (Twitter), you can pull data from any of our 130+ one-click, native integrations or from spreadsheets, databases and other APIs.
More 1-click dashboard templates
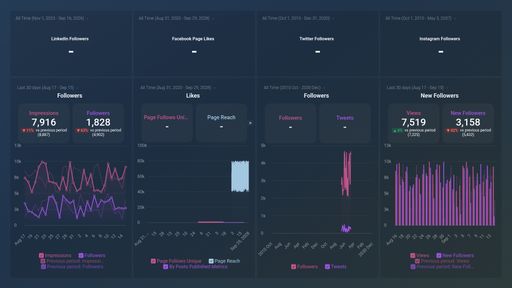
Social Networks (Growth & Engagement)
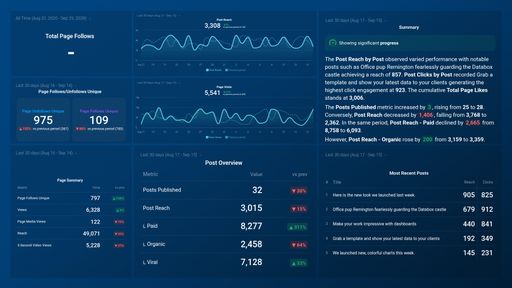
Facebook Page Insights
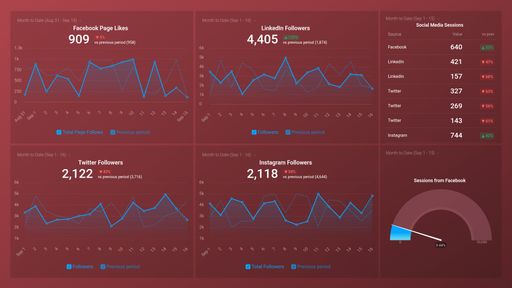
Social Media (Awareness & Engagement)
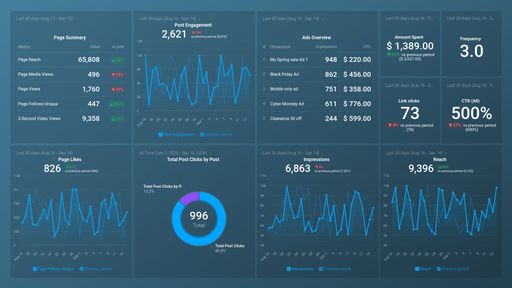
Facebook Pages & Facebook Ads: Engagement Summary
Customize this dashboard with Databox
Customize this template with Databox's Dashboard Designer. Add metrics, visualizations, and data from any source with simple drag and drop.
