


Already have an account? Sign in
Sign up for free
Connect your datasources and instantly see your data in this template.
Creating your account...
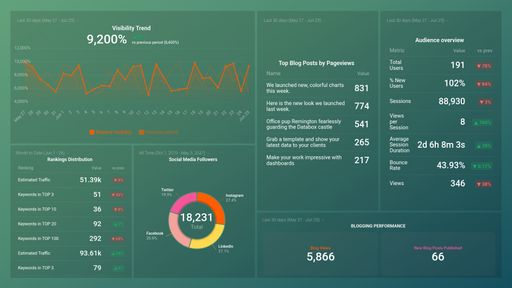
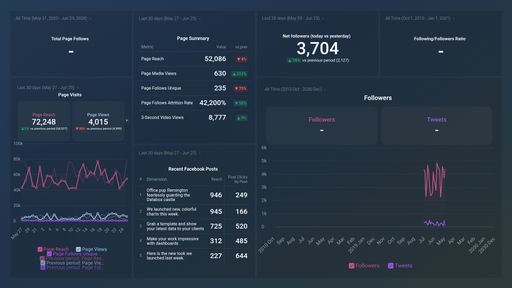
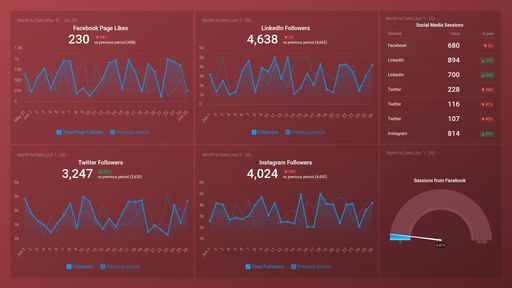
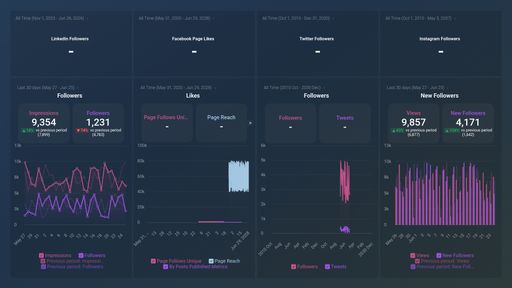
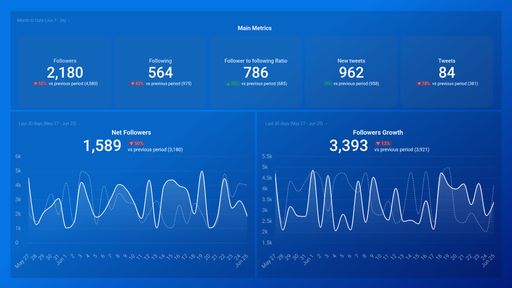
A Twitter dashboard displays the metrics and KPIs for your social media marketing strategy in real-time and in the form of captivating and comprehensive visualizations. By tracking your most important Twitter metrics, you will be able to gain insights that can help you further develop your marketing strategy, increase engagement, and ensure that your team and your clients hit your social media goals.
A Twitter dashboard needs to include all your most important KPIs and metrics. It should be able to answer questions like “How does my audience engage with my Twitter content?” or “How many people are my tweets reaching?” at a glance. Here are some of the metrics and KPIs to include in your Twitter dashboard – Followers, Following, Mentions, Retweets, Media Likes, website Clicks and more.


Drag & drop your metrics
No-code editor
Fully customizable
Trusted by 20,000+ growing businesses


Explore all the different ways you can use Databox to gain better data insights needed to drive better business decisions. Discover our pre-built templates from various integrations that businesses use on a daily basis to improve performance.
Whether you are looking for client reporting dashboards, agency dashboards, marketing dashboards, or sales dashboards, Databox can help you build them.
Let us know what you are trying to build and our team of experts will help you turn your data into actionable insights.
Book a callCompare
Databox Inc.
HQ: Boston, MA, USA
AI-powered analytics for teams that need answers now.
Databox Inc.
HQ: Boston, MA, USA

AI-powered analytics for teams that need answers now.


Compare
Connect your datasources and instantly see your data in this template.
Creating your account...