
Already have an account? Sign in
Sign up for free
Connect your datasources and instantly see your data in this template.
Creating your account...
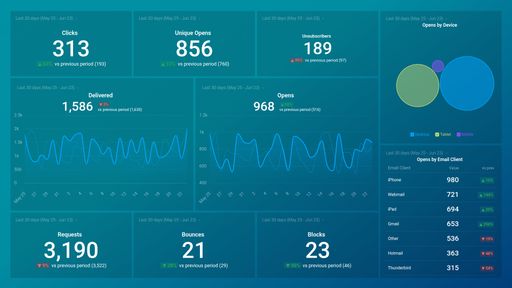
A SendGrid dashboard is a customizable tool for tracking, visualizing, and monitoring the performance of email campaigns. The tool helps users track delivery success, recipient engagement, and overall campaign performance, allowing data-driven optimization for successful email marketing strategies.
A comprehensive SendGrid dashboard should track essential email performance KPIs such as Delivered, Opens, Clicks, Unsubscribes, Bounces, Blocks, and Requests. These metrics offer valuable insights into the deliverability of your emails, the level of recipient engagement, campaign effectiveness, and any potential deliverability issues that need to be addressed.


Drag & drop your metrics
No-code editor
Fully customizable
Trusted by 20,000+ growing businesses


Explore all the different ways you can use Databox to gain better data insights needed to drive better business decisions. Discover our pre-built templates from various integrations that businesses use on a daily basis to improve performance.
Whether you are looking for client reporting dashboards, agency dashboards, marketing dashboards, or sales dashboards, Databox can help you build them.
Let us know what you are trying to build and our team of experts will help you turn your data into actionable insights.
Book a callCompare
Databox Inc.
HQ: Boston, MA, USA
AI-powered analytics for teams that need answers now.
Databox Inc.
HQ: Boston, MA, USA

AI-powered analytics for teams that need answers now.


Compare
Connect your datasources and instantly see your data in this template.
Creating your account...