Start a Free Trial, No Credit Card Needed
Everyone starts with a free 14-day trial of our Growth plan, with access to all advanced analytics features. Then choose any plan that best suits your needs.
Creating your account...
An Eventbrite dashboard provides a centralized overview of event performance data. It visually displays essential metrics, offering insights into ticket sales, audience engagement, and overall event success, enabling organizers to make informed, data-driven decisions for future events.
For a comprehensive view, an Eventbrite dashboard should track key metrics like Quantity Sold, Page Views, Gross and Net Sales, Attendee counts, Fees, and Event Capacity. By analyzing these metrics, organizers gain valuable insights into sales trends, event reach, revenue streams, audience demographics, and logistical considerations, allowing them to tailor future events for maximum impact.
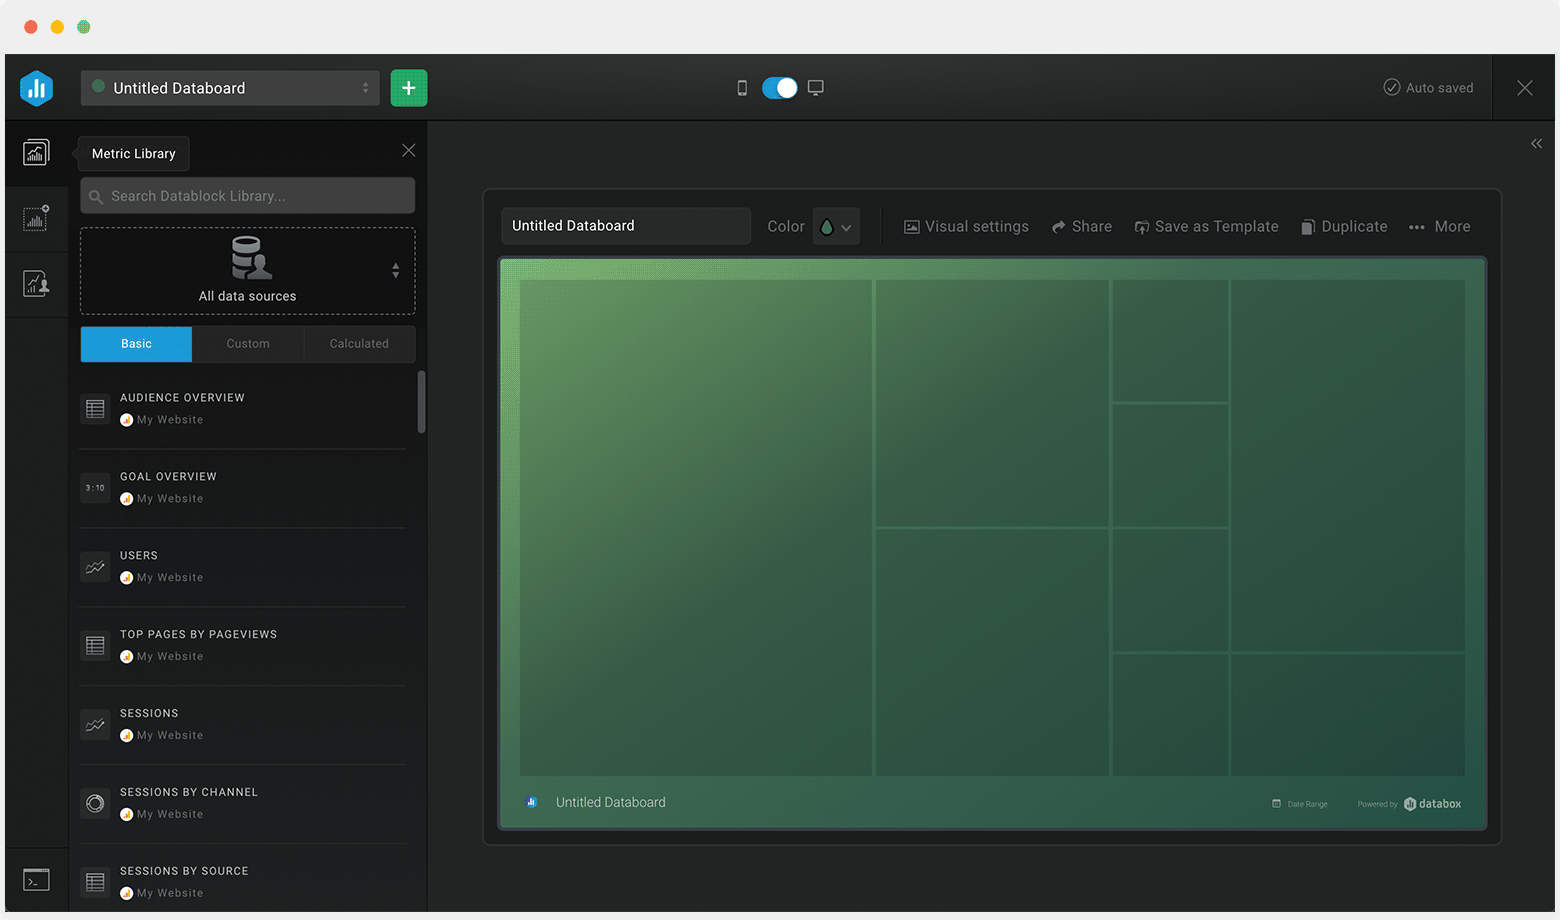
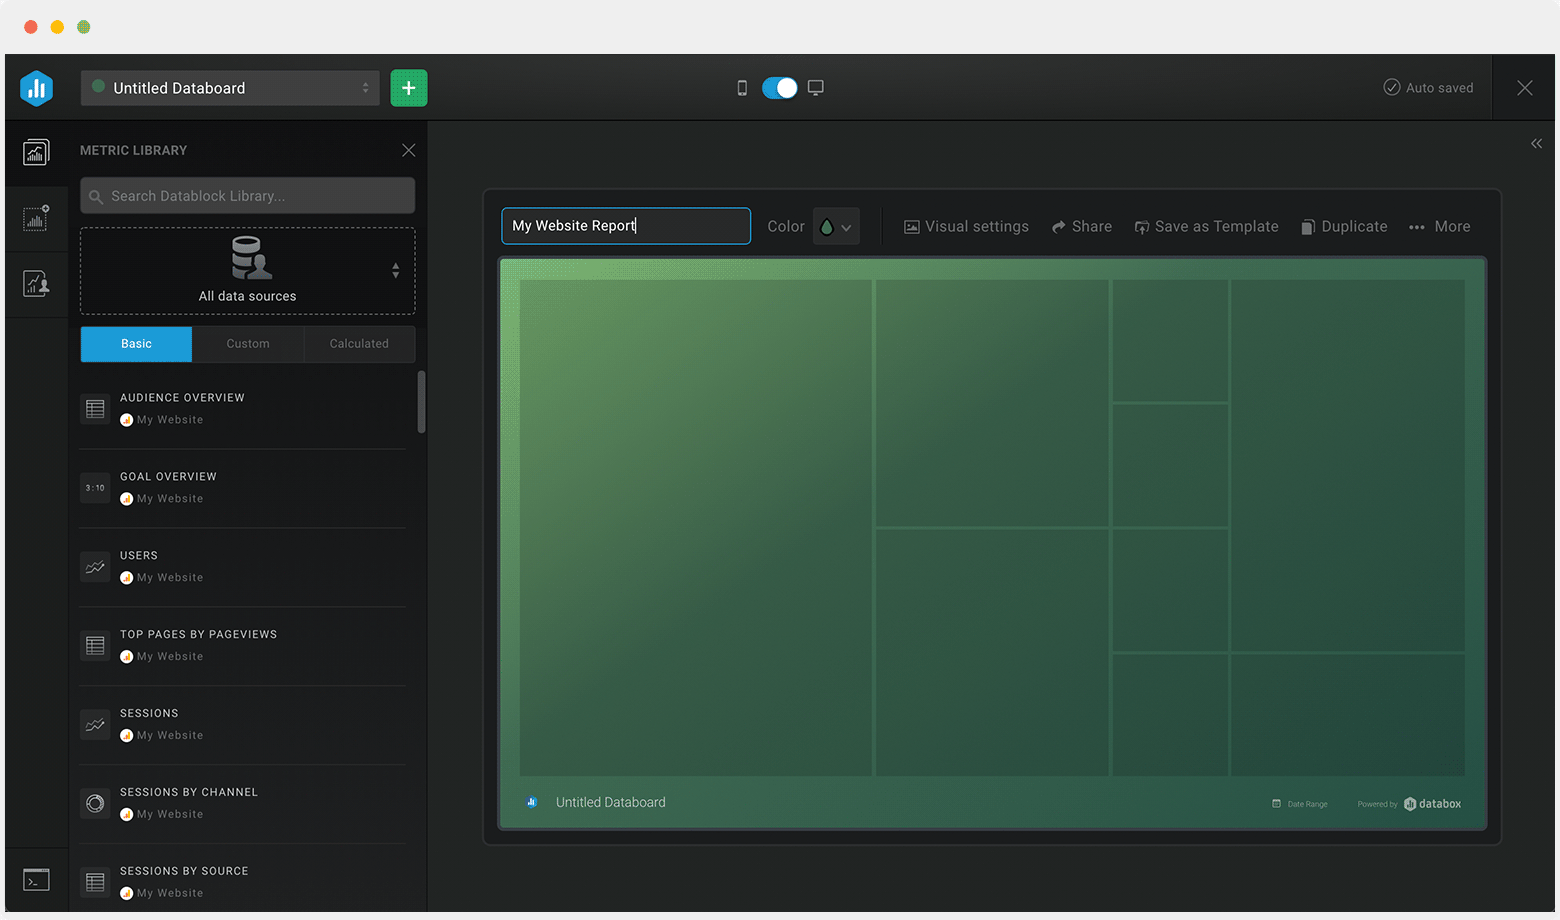
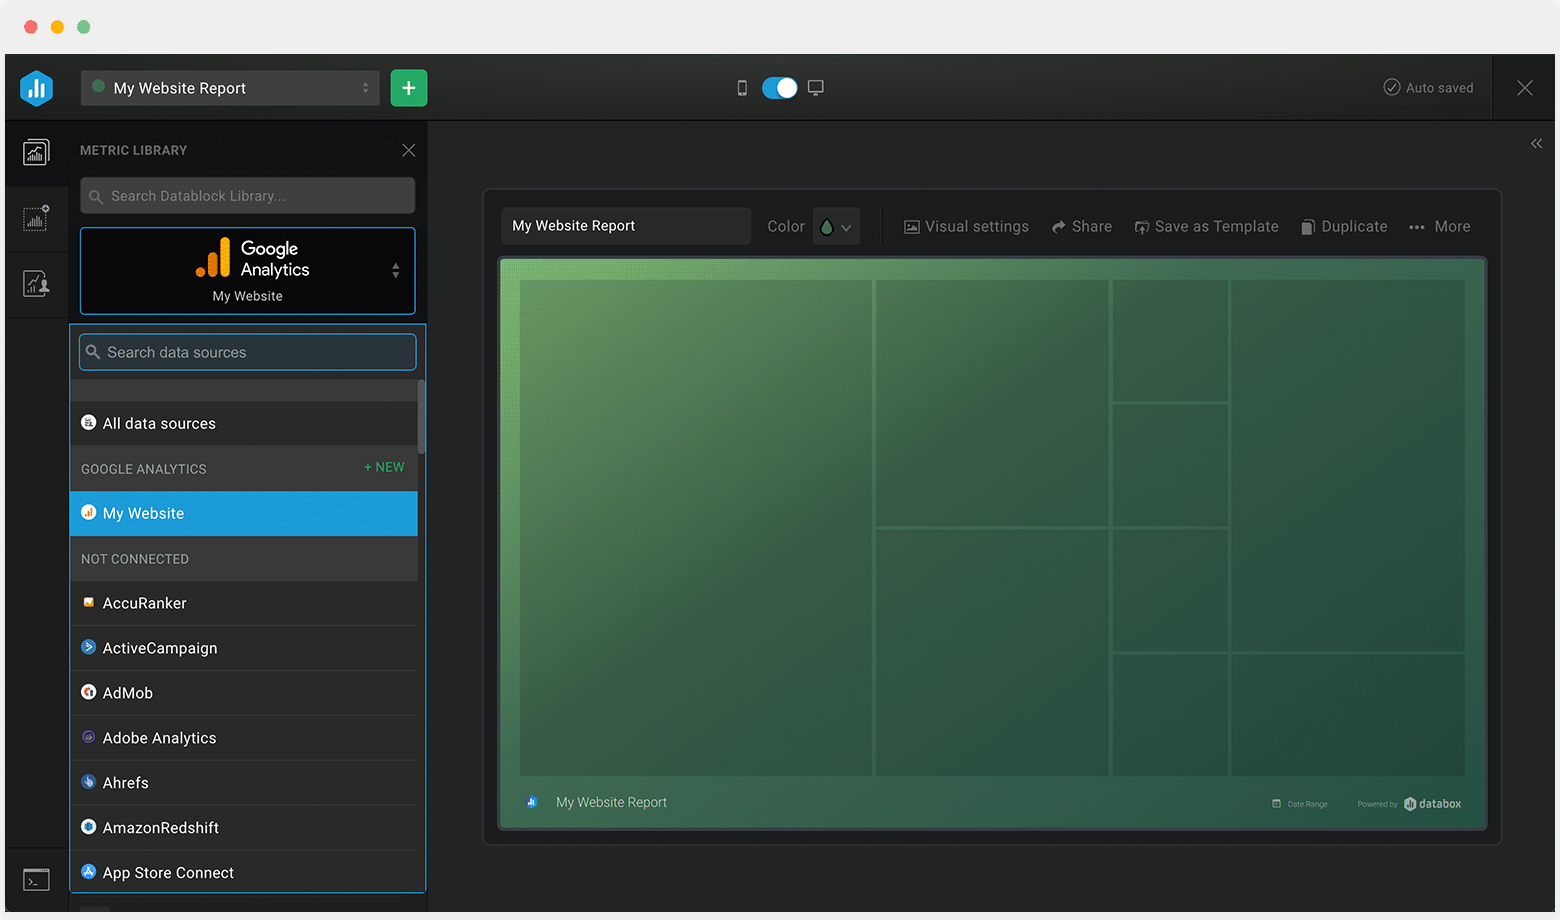
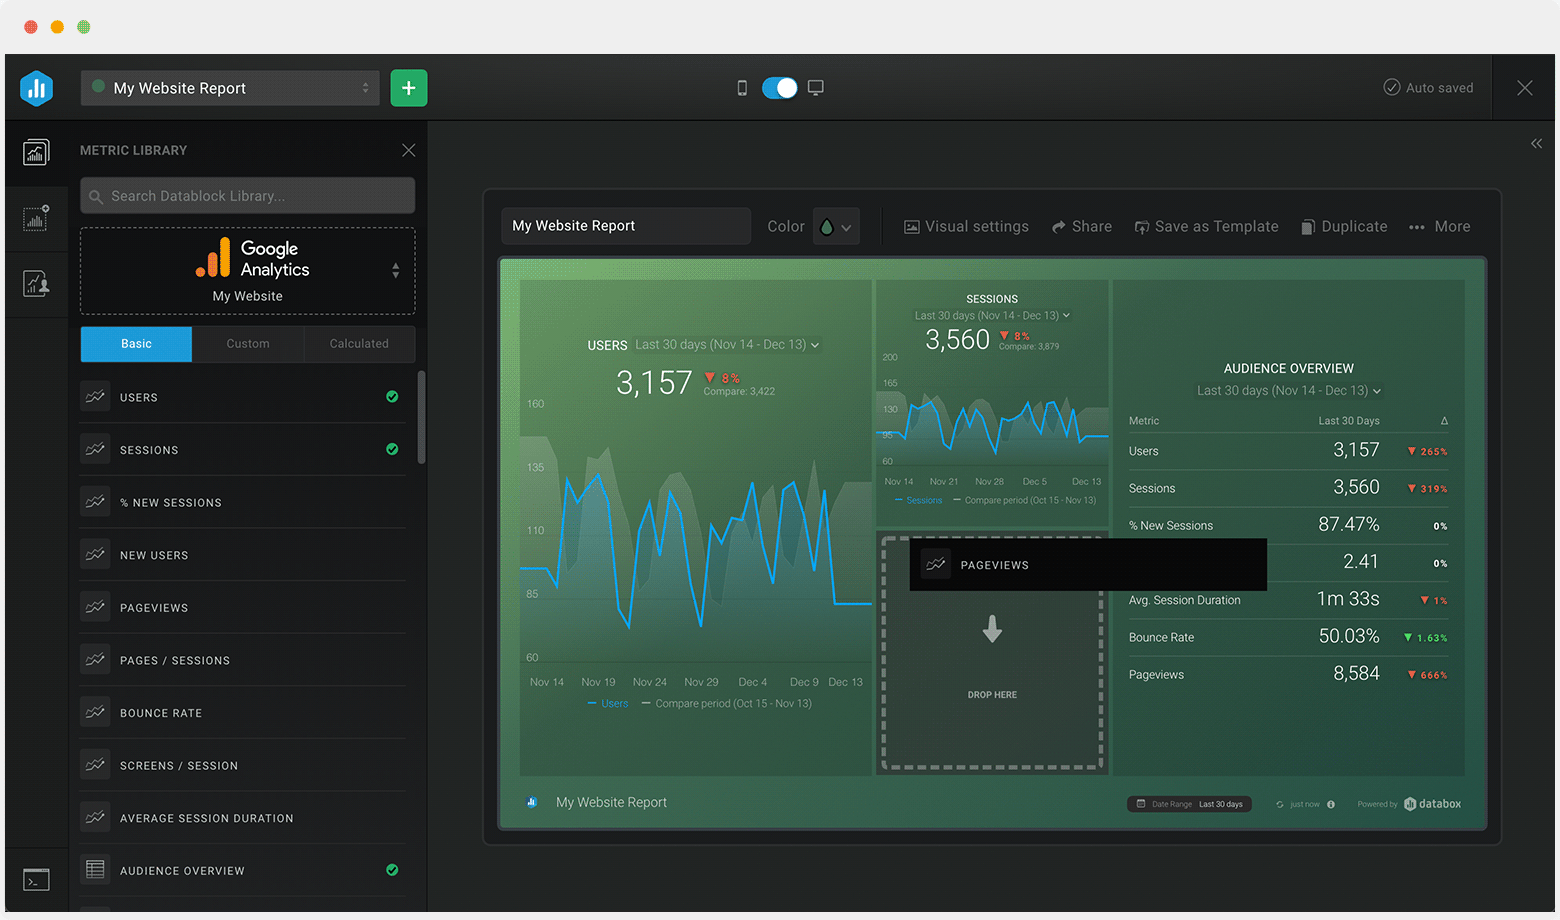
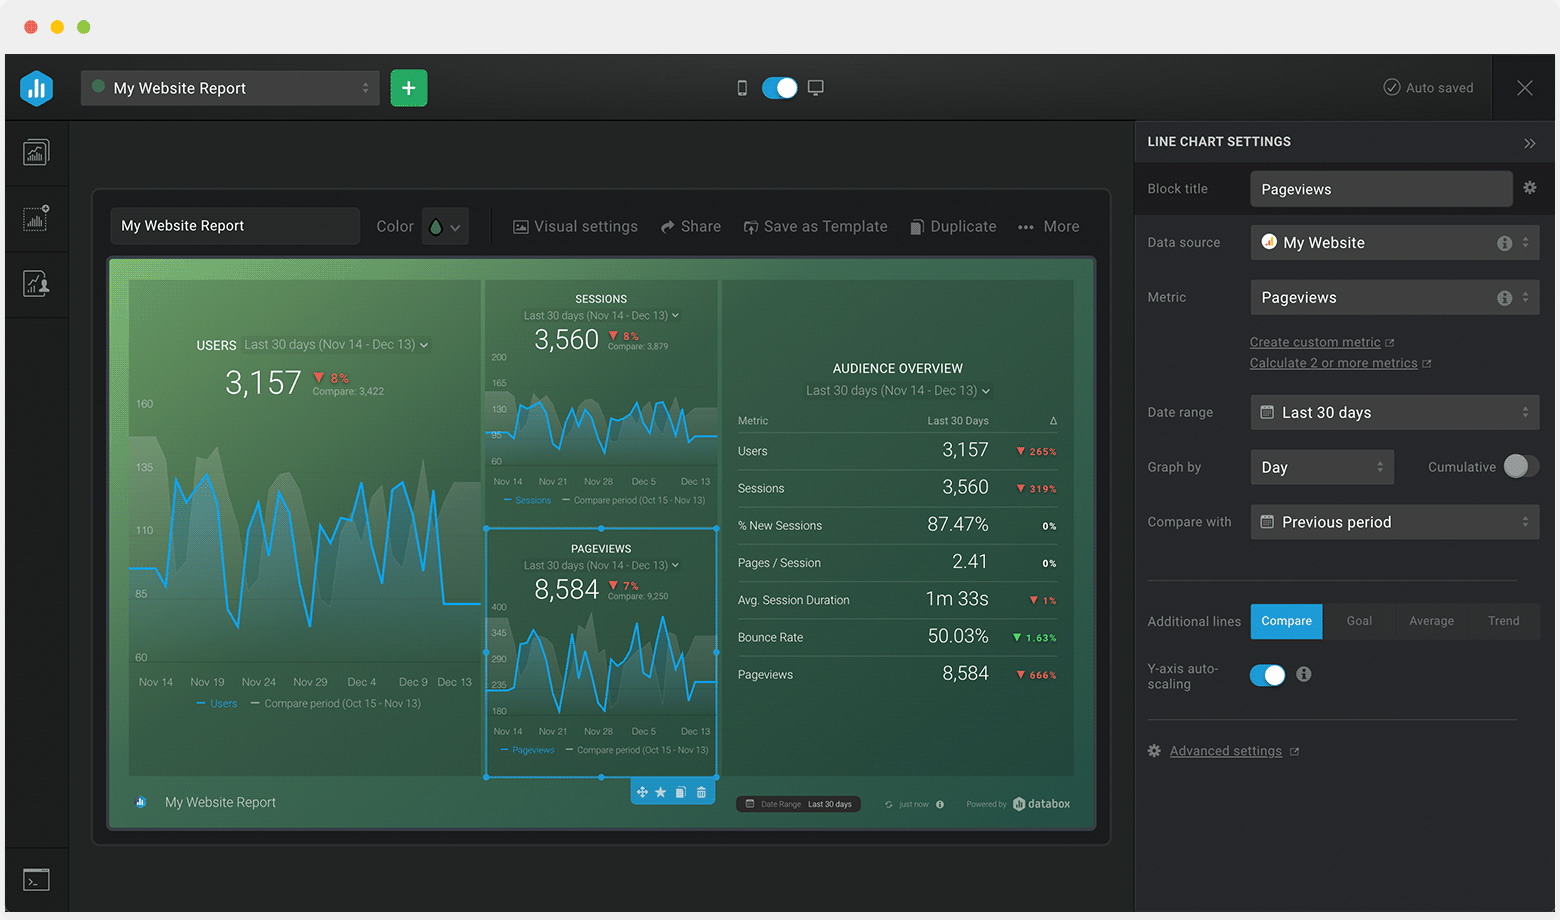

Drag & drop your metrics
No-code editor
Fully customizable
Trusted by 20,000+ growing businesses


Explore all the different ways you can use Databox to gain better data insights needed to drive better business decisions. Discover our pre-built templates from various integrations that businesses use on a daily basis to improve performance.
Whether you are looking for client reporting dashboards, agency dashboards, marketing dashboards, or sales dashboards, Databox can help you build them.
Let us know what you are trying to build and our team of experts will help you turn your data into actionable insights.
Book a call