
Already have an account? Sign in
Sign up for free
Connect your datasources and instantly see your data in this template.
Creating your account...
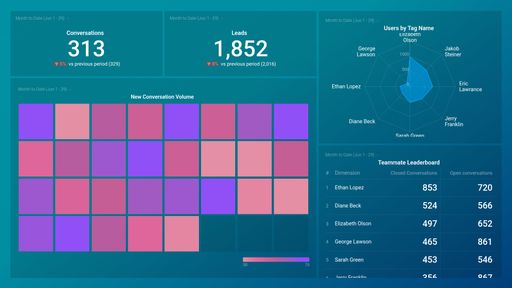
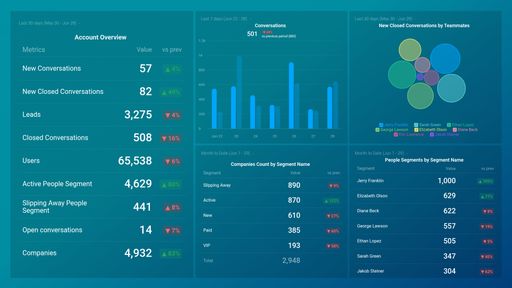
An Intercom dashboard serves as a powerful tool for businesses to streamline their customer communication processes, improve engagement, and drive growth by providing insights and tools to interact with customers across different channels effectively. It allows you to track, visualize, and monitor all of your most relevant KPIs and metrics, providing you with actionable insights to improve your customer support and overall customer interactions.
An Intercom dashboard should include your most important metrics and KPIs that allow you to track your customer communication and engagement efforts. For example, metrics like New People, New Conversations, People and Companies, and Open and Closed Conversation provide insights on how fast your user base grows, who handles the most conversations and what the popular times of day for a chat are.


Drag & drop your metrics
No-code editor
Fully customizable
Trusted by 20,000+ growing businesses


Explore all the different ways you can use Databox to gain better data insights needed to drive better business decisions. Discover our pre-built templates from various integrations that businesses use on a daily basis to improve performance.
Whether you are looking for client reporting dashboards, agency dashboards, marketing dashboards, or sales dashboards, Databox can help you build them.
Let us know what you are trying to build and our team of experts will help you turn your data into actionable insights.
Book a callCompare
Databox Inc.
HQ: Boston, MA, USA
AI-powered analytics for teams that need answers now.
Databox Inc.
HQ: Boston, MA, USA

AI-powered analytics for teams that need answers now.


Compare
Connect your datasources and instantly see your data in this template.
Creating your account...