
Already have an account? Sign in
Sign up for free
Connect your datasources and instantly see your data in this template.
Creating your account...
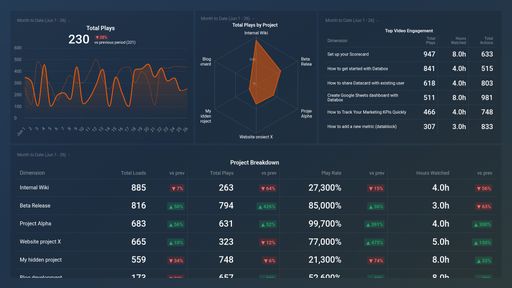
A Wistia dashboard is a dynamic tool for tracking and analyzing key metrics from video content hosted and managed through the Wistia platform. It offers a visual overview of video performance data to help in decision-making and content optimization.
A Wistia dashboard should include essential metrics like Play Rate, Engagement Rate, Hours Watched, and Loads. These metrics provide insights into viewer engagement and video performance, helping refine marketing strategies and content creation efforts.


Drag & drop your metrics
No-code editor
Fully customizable
Trusted by 20,000+ growing businesses


Explore all the different ways you can use Databox to gain better data insights needed to drive better business decisions. Discover our pre-built templates from various integrations that businesses use on a daily basis to improve performance.
Whether you are looking for client reporting dashboards, agency dashboards, marketing dashboards, or sales dashboards, Databox can help you build them.
Let us know what you are trying to build and our team of experts will help you turn your data into actionable insights.
Book a callCompare
Databox Inc.
HQ: Boston, MA, USA
AI-powered analytics for teams that need answers now.
Databox Inc.
HQ: Boston, MA, USA

AI-powered analytics for teams that need answers now.


Compare
Connect your datasources and instantly see your data in this template.
Creating your account...