
Already have an account? Sign in
Sign up for free
Connect your datasources and instantly see your data in this template.
Creating your account...
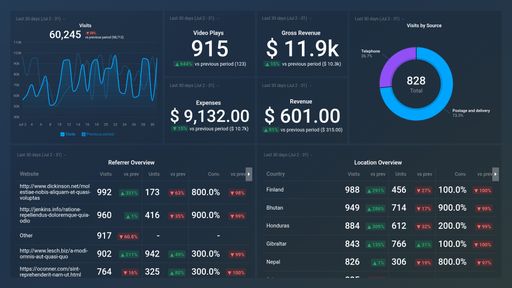
A Vimeo OTT dashboard is a customizable tool that offers a consolidated view of your video performance metrics. Vimeo OTT dashboards reveal valuable insights into the growth of your member’s list, number of viewers your content receives, help you monitor the completion rate for every one of your videos, and more.
A well-designed Vimeo OTT dashboard should track key video metrics such as Visit, Expenses, Revenue, Conversion Rates, Video Plays by Video, and more. These metrics showcase viewership patterns, audience preferences, and the overall effectiveness of your video content.


Drag & drop your metrics
No-code editor
Fully customizable
Trusted by 20,000+ growing businesses


Explore all the different ways you can use Databox to gain better data insights needed to drive better business decisions. Discover our pre-built templates from various integrations that businesses use on a daily basis to improve performance.
Whether you are looking for client reporting dashboards, agency dashboards, marketing dashboards, or sales dashboards, Databox can help you build them.
Let us know what you are trying to build and our team of experts will help you turn your data into actionable insights.
Book a call


Connect your datasources and instantly see your data in this template.
Creating your account...