


Table of contents
So you have finally written a great comprehensive business report that took you weeks to create. You have included all the data from the different departments, compared it, done the analysis, made forecasts, and provided solutions to specific problems.
There is just one problem – the key stakeholders in the company don’t have enough time to go through the whole report.University of Pennsylvania Wharton School study found that executives spend an average of 2.5 hours per week on report reading.
Since the data and the KPIs that you included in the report are necessary for quality decision-making, you can see why this can become a huge issue.
Luckily, there is a way to present all of your key findings and not take too much of their time. This is done through executive summaries. In fact, a survey by the International Association of Business Communicators revealed that 85% of organizations utilize executive summaries in their reporting processes, highlighting their importance in business communication.
An executive summary is exactly what the name suggests – a summary. It is essentially a quick overview of all the most important metrics in the report. The purpose of this summary is to bring the attention of the highest-ranking members in the company to the most important KPIs that they will consider when making decisions.
While an executive summary is a rather short section, it doesn’t mean that it’s easy to write. You will have to pay extra attention to every single sentence in order to avoid unnecessary information.
Do you want to learn how to create an informative executive summary? This guide will show you all you need to know.
- What Is an Executive Report?
- What Is an Executive Summary in a Report?
- How Long Should an Executive Summary Be?
- Who Is the Audience of an Executive Summary?
- What Should Be Included in an Executive Summary Report?
- How to Write an Executive Summary Report?
- Common Mistakes to Avoid When Writing Executive Summaries
- Executive Report Examples
- Executive Summary Templates
- Create Executive Reports in Databox

What Is an Executive Report?
A business report executive summary is designed to keep senior managers informed about the latest and most significant activities within the company. These reports have to be concise and accurate since they will have a huge impact on the most important business-related decisions.
Working for any sort of company requires writing different types of reports such as financial reports, marketing reports, sales reports, internal reports, and more.
What all of these reports have in common is that they are very comprehensive and typically require a lot of time to go through them –way too much time, if you ask busy managers.
They include a wealthy amount of data and a bunch of different metrics which are more useful for a particular team in the company. However, the highest-ranking members tend to be more focused on only the most essential KPIs that they need for making future decisions and strategies.
This is why executive reports come in handy. They are usually only a few pages long and they include only the most relevant details and data that incurred in a specific period.
What Is an Executive Summary in a Report?
An executive summary is the brief overview section included in a long report or document. This part of the report primarily focuses on the key topics and most important data within it. It can include an overall business goal of the company or short-term strategic objectives.
This summary is primarily useful for C-level managers who don’t have time to read the whole report but want to have an insight into the main KPIs and latest business performances.
Bank officials also may use executive summaries since it’s the quickest way for them to estimate whether your company represents a good investment opportunity.
Depending on your company’s practice, executive summaries can either be placed at the beginning of the report or as a formal section in the table of contents. This is especially true for documents like project proposals, where a clear summary can make a significant difference.
The length of the summary depends on the type of report, but it is typically one or two pages long.
To know whether you have written a good executive summary, you can ask yourself, “Are the stakeholders going to have all the information they need to make decisions?”
If the answer is yes, you have done a good job.
How Long Should an Executive Summary Be?
There is no strict rule about how long executive summaries should be. Each company is unique which means the length will always vary. In most cases, it will depend on the size of the report/business plan.
However, a universal consensus is that it should be anywhere from one to four pages long or five to ten percent of the length of the report.
This is typically more than enough space to summarize the story behind the data and provide your stakeholders with the most important KPIs for future decision-making.
Who Is the Audience of an Executive Summary?
The people most interested in reading the executive summary are typically the ones who don’t have time to read the whole report and want a quick overview of the most important data and information.
These include:
- Project stakeholders – The individuals or organizations that are actively involved in a project with your company.
- Management personnel (decision-makers) – The highest-ranking employees in your company (manager, partner, general partner, etc.)
- Investors – As we said, this could be bank officials who want a quick recap of your company’s performance so they can make an easier investment decision.
- Venture capitalists – Investors who provide capital in exchange for equity stakes.
- C-level executives – The chief executives in your business.
Related: Reporting Strategy for Multiple Audiences: 6 Tips for Getting Started
What Should Be Included in an Executive Summary Report?
The components of your executive summary depend on what is included in the overall larger document. Executive summary elements may also vary depending on the type of document (business plan, project, report, etc.), but there are several components that are considered universal.
These are the main elements you should include:
- Purpose
- Problem
- Methods of analyzing the problem
- Solutions to the problem
- The ‘Why Now’ segment
- Well-defined conclusion
1. Purpose
The purpose of the summary should typically be included in the introduction as an opening statement. Explain what you aim to achieve with the document and communicate the value of your desired objective.
This part is supposed to grab your reader’s attention, so make sure they pay extra attention when writing it.
2. Problem
Problems are an unavoidable element in modern-day businesses, even in the most successful companies.
The second thing your executive summary needs to outline is what specific problem you are dealing with. It could be anything from product plans and customer feedback to sales revenue and marketing strategies.
Define the problems clearly so all the members know which areas need fixing.
3. Methods of analyzing the problem
Problem analysis methods are key for identifying the causes of the issue.
While figuring out the problems and the methods to solve them is immensely important, you shouldn’t overlook the things that caused them. This will help you from avoiding similar issues in the future.
4. Solutions to the problem
Now that you’ve introduced the stakeholders to the problems, it’s time to move on to your solutions. Think of a few different ways that could solve the issue and include as many details as you can.
5. The ‘Why Now’ segment
This is one of the most important parts of your executive summary.
The ‘Why Now’ segment showcases why the problem needs to be solved in a timely manner. You don’t want the readers to get the impression that there is plenty of time to fix the issue.
By displaying urgency in your summary, your report will have a much bigger impact.
One of the ways to display urgency visually is by adding performance benchmarks to your report. In case your business is not performing well as other companies within your industry, only one image showcasing which metrics are below the median could make a compelling case for the reader.
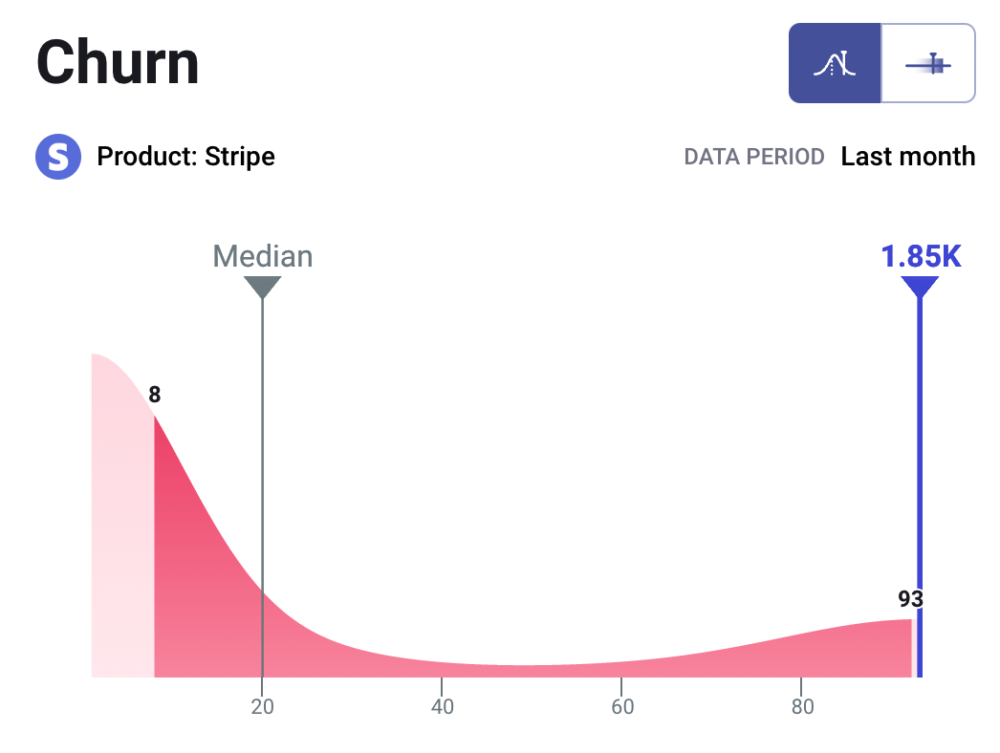
For example, if you have discovered that your churn rate is much higher than for an average SaaS company, this may be a good indication that you have issues with poor customer service, poor marketing, pricing issues, potentially outdated product features, etc
When you’re reviewing performance gaps like churn, it’s also helpful to quickly understand what changed and why. Instead of manually digging through dashboards, teams now use AI data analysts like Databox MCP to ask plain-English questions about their metrics and get answers based on their actual historical data and definitions. This makes it easier to interpret trends, clarify the drivers behind underperformance, and validate whether an issue is isolated or part of a broader pattern before presenting conclusions in the executive summary.
Benchmark Your Performance Against Hundreds of Companies Just Like Yours
Viewing benchmark data can be enlightening, but seeing where your company’s efforts rank against those benchmarks can be game-changing.
Browse Databox’s open Benchmark Groups and join ones relevant to your business to get free and instant performance benchmarks.
Well-defined conclusion
Lastly, you should end your executive summary with a well-defined conclusion.
Make sure to include a recap of the problems, solutions, and the overall most important KPIs from the document.
How to Write an Executive Summary Report?
Okay, so you understand the basics of executive summaries and why they are so important. However, you still aren’t sure how to write one.
Don’t worry.
Here are some of the best practices you can use to create amazing executive summaries that will impress your key stakeholders and high-ranking members.
- Write it Last
- Grab Their Attention
- Use Appropriate Language
- Talk Strategy
- Include Forecasts
- Highlight Funding Needs
- Make it Short
Write it Last
The most natural way to write your executive summary is by writing it at the end of your report/business plan.
This is because you will already have gone through all the most important information and data that should later be included.
A good suggestion is to take notes of all the significant KPIs that you think should be incorporated in the summary, it will make it easier for you to later categorize the data and you will have a clearer overview of the key parts of the report.
You may think that you already know which data you are going to include, but once you wrap up your report, you will probably run into certain things that you forgot to implement. It’s much easier to create an executive summary with all the data segmented in one place, than to rewrite it later.
Grab Their Attention
While your primary goal when creating the executive summary is to make it informative, you also have to grab the attention of your readers so that you can motivate them to read the rest of the document.
Once they finish reading the last few sentences of the summary, the audience should be looking forward to checking out the remanding parts to get the full story.
If you are having trouble with finding ways to capture the reader’s attention, consider coaching sessions with colleagues from the sales department to lend a hand. After all, that’s their specialty.
Use Appropriate Language
One more important element is the type of language you use in the summary. Keep in mind who will be reading the summary, your language should be adjusted to a group of executives.
Make the summary understandable and avoid using complicated terms that may cause confusion, your goal is to feed the stakeholders with important information that will affect their decision-making.
This doesn’t only refer to the words that you use, the way in which you provide explanation should also be taken into consideration. People reading the report should be able to easily and quickly understand the main pain points that you highlighted.
Talk Strategy
You should have a specific part in your executive summary where you will focus on future strategies. This part should include information regarding your project, target market, program, and the problems that you think should be solved as soon as possible.
Also, you should provide some useful insights into the overall industry or field that your business operates in. Showcase some of the competitive advantages of your company and specific marketing insights that you think the readers would find interesting.
Related: What Is Strategic Reporting? 4 Report Examples to Get Inspiration From
Include Forecasts
Make one of the sections revolve around financial and sales forecasts for the next 1-3 years. Provide details of your breakeven points, such as where the expenses/revenues are equal and when you expect certain profits from your strategies.
This practice is mainly useful for business plans, but the same principle can be applied to reports. You can include predictions on how your overall objectives and goals will bring profit to the company.
Related: How Lone Fir Creative Uses Databox to Forecast, Set, & Achieve Agency & Client Goals
Highlight Funding Needs
Don’t forget to talk about the funding needs for your projects since there is a high chance that investors will find their way to the executive summary as well.
You can even use a quotation from an influential figure that supports your upcoming projects. Include the costs that will incur but also provide profitability predictions that will persuade the investors to fund your projects.
Make it Short
While your report should include all of the most important metrics and data, aim for maximum conciseness.
Don’t include any information that may be abundant and try to keep the executive summary as short as possible. Creating a summary that takes up dozens of pages will lose its original purpose.
If you’re in for a quick workaround, then the AI summarizer is the best option. It will automate the concision process so that you save time and resources crafting your executive summaries.
With a concise summary and clear communication of your messages, your readers will have an easy time understanding your thoughts and then take them into consideration.
Also, one last tip is to use a positive tone throughout the summary. You want your report to exude confidence and reassure the readers.
PRO TIP: How Well Are Your Marketing KPIs Performing?
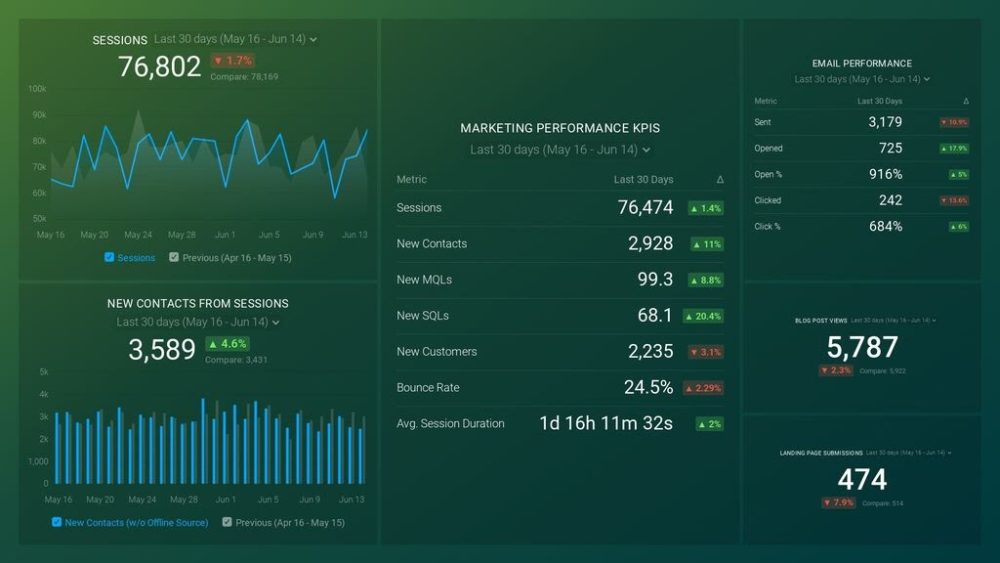
Like most marketers and marketing managers, you want to know how well your efforts are translating into results each month. How much traffic and new contact conversions do you get? How many new contacts do you get from organic sessions? How are your email campaigns performing? How well are your landing pages converting? You might have to scramble to put all of this together in a single report, but now you can have it all at your fingertips in a single Databox dashboard.
Our Marketing Overview Dashboard includes data from Google Analytics 4 and HubSpot Marketing with key performance metrics like:
- Sessions. The number of sessions can tell you how many times people are returning to your website. Obviously, the higher the better.
- New Contacts from Sessions. How well is your campaign driving new contacts and customers?
- Marketing Performance KPIs. Tracking the number of MQLs, SQLs, New Contacts and similar will help you identify how your marketing efforts contribute to sales.
- Email Performance. Measure the success of your email campaigns from HubSpot. Keep an eye on your most important email marketing metrics such as number of sent emails, number of opened emails, open rate, email click-through rate, and more.
- Blog Posts and Landing Pages. How many people have viewed your blog recently? How well are your landing pages performing?
Now you can benefit from the experience of our Google Analytics and HubSpot Marketing experts through a plug-and-play Databox template. It includes key metrics for tracking your leads and can be used as a standalone dashboard or as part of your marketing reports. You can try it during your free trial no setup headaches.
You can easily set it up in just a few clicks – no coding required.
To set up the dashboard, follow these 3 simple steps:
Step 1: Get the template
Step 2: Connect your HubSpot and Google Analytics 4 accounts with Databox.
Step 3: Watch your dashboard populate in seconds.
Common Mistakes to Avoid When Writing Executive Summaries
No one expects you to become an expert in writing an executive summary overnight. Learning how to create great and meaningful summaries will inevitably take some time.
With the above-mentioned best practices in mind, you should also pay attention to avoiding certain mistakes that could reduce the value of your summaries.
Here are some examples.
- Don’t use jargon
- Avoid going into details
- The summary should be able to stand alone
- Don’t forget to proofread
Don’t use jargon
This can make your summary write more complex than necessary.
From project stakeholders to C-level executives (chief executives and board members), everyone should be able to easily understand and read the information you gather in your summary.
Keep in mind, you are probably much more familiar with some of the technical terms that your departments use since you are closer to the daily work and individual tasks than your stakeholders.
Read your summary once again after you finish it to make sure there are no jargons you forgot to elaborate on.
Avoid going into details
Remember, your summary should be as short as possible, but still include all the key metrics and KPIs. There is no reason to go into details of specific projects, due dates, department performances, etc.
When creating the summary, ask yourself twice whether the information you included truly needs to be there.
Of course, there are certain details that bring value to the summary, but learn how to categorize the useful ones from the unnecessary ones.
The summary should be able to stand alone
While you will know your way around the project, that doesn’t apply to the readers.
After wrapping up the summary, go over it once again to see whether it can stand on its own. This means checking out if there is any sort of context that the readers will need in order to understand the summary.
If the answer is yes, you will have to redo the parts that can’t be understood by first-time readers.
Don’t forget to proofread
Your executive summary is prone to changes, so making a typo isn’t the end of the world, you can always go back and fix it.
However, it’s not a bad idea to ask one of your colleagues to to review and proofread it as well, just so you have an additional set of eyes.
Executive Report Examples
Using reporting tools such as dashboards for executive reports can provide you with a birds-eye view of your company’s most important KPIs and data.
These dashboards work as visualization tools that will make all the important metrics much more understandable to your internal stakeholders.
Since executive reports on their own don’t include any visual elements such as graphs or charts, these dashboards basically grant them superpowers.
Executive reporting dashboards also make the decision-making process easier since there won’t be any misunderstandings regarding the meaning of the data.
Not only will you be able to gather the data in real-time, but you can also connect different sources onto the dashboard can use the visuals for performance comparisons.
Interested in giving executive report dashboards a try? Let’s check out some of the best examples.
- Marketing Performance Dashboard
- Customer Support Performance Dashboard
- Financial Overview Dashboard
- SaaS Management Dashboard
- Sales KPI Dashboard
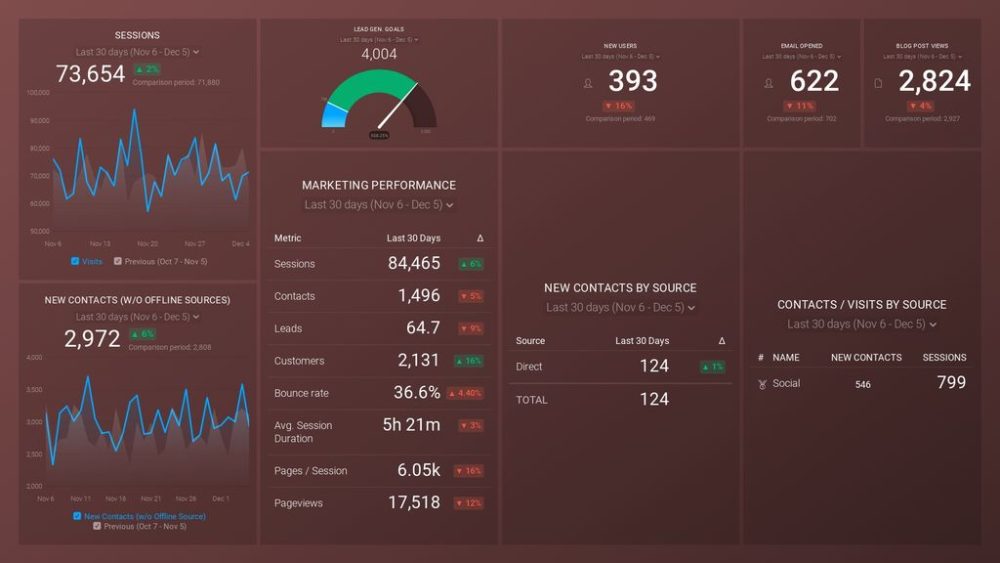
Marketing Performance Dashboard
To stay on top of your key user acquisition metrics, such as visit to leads conversion rates, email traffic, blog traffic, and more, you can use this Marketing Performance Dashboard.
You can pull in data from advanced tools such as HubSpot Marketing and Google Analytics to get a full overview of how your website generates leads.
Some of the things you will learn through this dashboard are:
- Which traffic sources are generating the most amount of leads
- How to track which number of users are new to your website
- How to compare the traffic you are getting from your email with blog traffic
- How to stay on top of lead generation goals each month
- How to be sure that your marketing activities are paying off
The key metrics included are bounce rate, new users, page/session, pageview, and average session duration.
Customer Support Performance Dashboard
You can use the Customer Support Performance Dashboard to track the overall performance of your customer service and check out how efficient individual agents are.
This simple and customizable dashboard will help you stay in touch with new conversation numbers, open/closed conversations by teammates, number of leads, and much more.
Also, you will get the answers to questions such as:
- How many new conversations did my customer support agents deal with yesterday/last week/last month?
- How many conversations are currently in progress?
- In which way are customer conversations tagged on Intercom?
- How to track the number of leads that the support team is generating?
- What is the best way to measure the performance of my customer support team?
Some of the key metrics are leads, open conversations, new conversations, tags by tag name, closed conversations, and more.

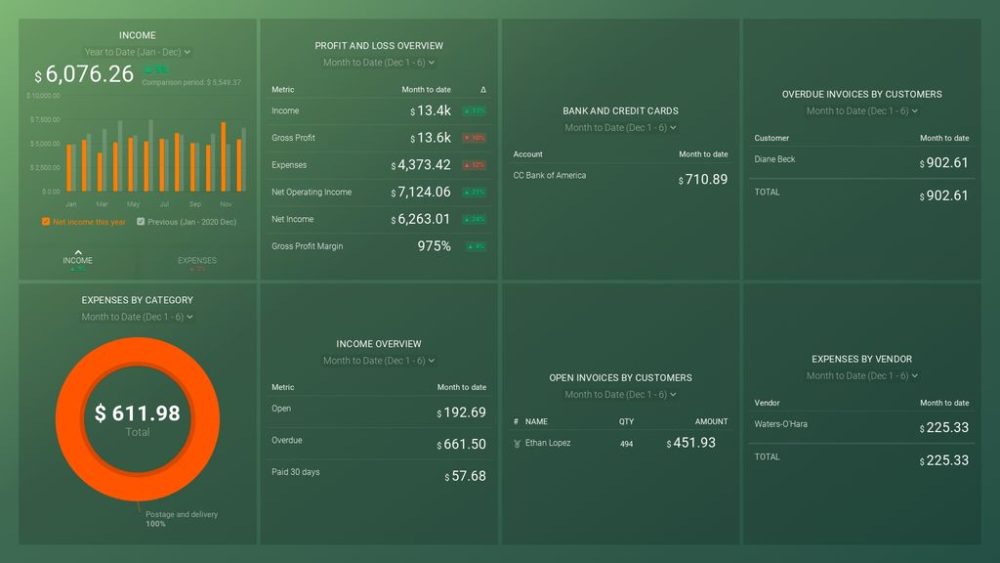
Financial Overview Dashboard
Want to know how much income your business generated last month? How to measure the financial health of your business? How about figuring out the best way to track credit card purchases?
You can track all of these things and more by using the Financial Overview Dashboard.
This fully customizable dashboard will help you gain an insight into all of your business’s financial operations, cash flow, bank accounts, sales, expenses, and plenty more.
Understanding your company from a financial standpoint is one of the most important ingredients of good decision-making.
With key metrics such as gross profit, net income, open invoices, total expenses, and dozens more – all gathered in one financial reporting software, you will have no problems staying on top of your financial activities.
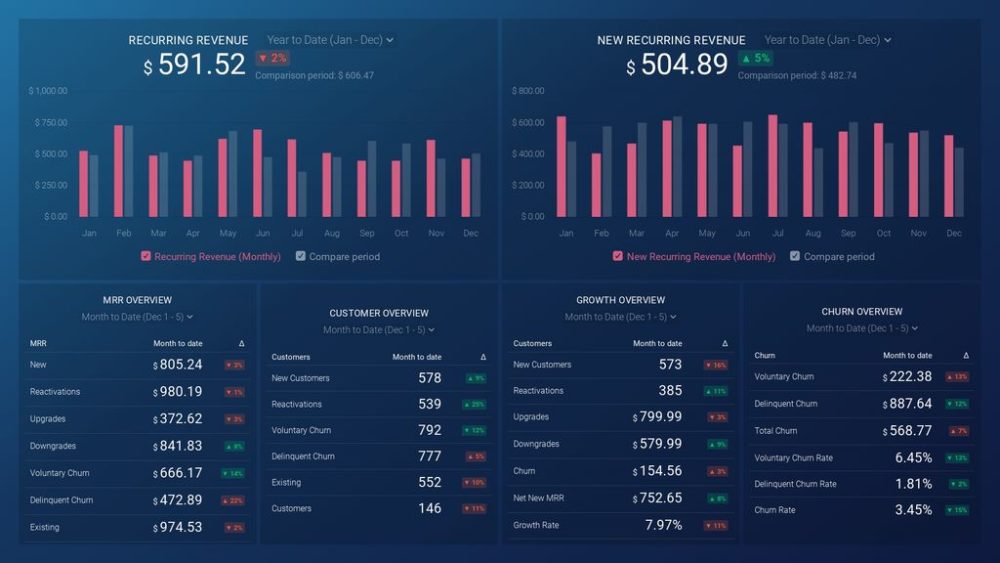
SaaS Management Dashboard
Use this SaaS Management Dashboard to have a clear overview of your business’s KPIs in real-time. This customizable dashboard will help you stay competitive in the SaaS industry by providing you with comprehensive data that can you can visualize, making it more understandable.
You will be able to:
- See how your company is growing on an annual basis
- Have a detailed outline of your weakest and strongest months
- Determine which strategies are most efficient in driving revenue
The key metrics included in this dashboard are recurring revenue, churn by type, MRR changes, and customer changes.
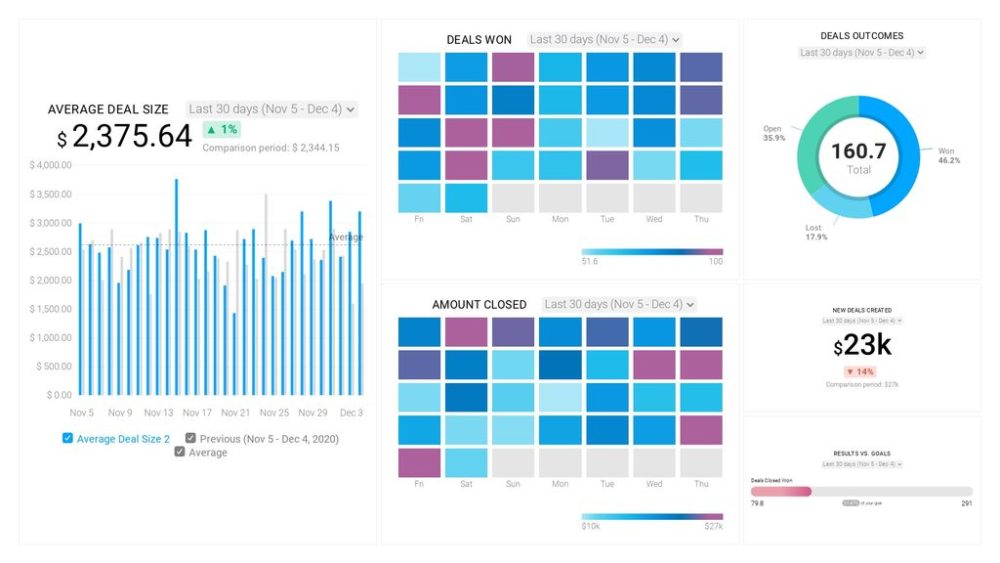
Sales KPI Dashboard
Do you want to monitor your sales team’s output and outcomes? Interested in tracking average deal sizes, number of won deals, new deals created, and more?
This Sales KPI Dashboard can help you do just that.
It serves as a perfect tool for sales managers that are looking for the best way to create detailed overviews of their performances. It also helps achieve sales manager goals for the pre-set time periods.
By connecting your HubSpot account to this customizable dashboard, you can learn:
- What’s the average deal size
- The number of open, closed, and lost deals each month
- How much revenue you can expect from the new deals
- How your business is progressing towards the overall sales goals
Executive Summary Templates
Although you probably understand what your executive summary should include by now, you may still need a bit of help with creating a clear outline to follow.
We thought about that too. Here are some template examples that will help you create an effective summary outline for different kinds of business needs.
Here is an executive summary template for a business plan:
- Introduction
- [Mission]
- [Vision]
- [Company profile (with relevant history)]
- [Company contact details]
- Products and services
- [Description of products and/or services]
- [Unique proposition]
- [Competitive advantage]
- [Intellectual property]
- [Development status]
- Market analysis
- [Market opportunity]
- [Target market]
- [Competitors]
- Financial analysis
- [Budget]
- [Funding needs]
- [Potential price of goods]
- [Projected profit margins for year one and two]
- Conclusions
- [Summarize main points]
Executive summary template for marketing plan:
- Product name
- [Product description]
- Target audience
- [Unique customer characteristics]
- [Customer spending habits]
- [Relationship to product]
- [Access channels]
- The product
- [Value and credibility of product]
- [Product competitive advantage]
- [Creative outlook]
- [Keywords]
- Strategy and objectives
- [Goal statement]
- [Task 1]
- [Task 2]
- [Task 3]
- Budget
- [Overview]
- [Forecasted cost]
- Action timeline
- [Today]
- [Next week]
- [Next month]
Executive summary template for a research report
- [Project topic]
- [Name | Date]
- [Report introduction]
- [Background]
- [Research methods]
- [Conclusions]
- [Recommendations]
Executive summary template for project executive
- [Project name]
- [Program name]
- [Project lead]
- [Prepared by]
- [Date]
- [Project milestones]
- [Status overviews]
- [New requests]
- [Issues summary]
- [Project notes]
Create Executive Reports in Databox
For the longest time, writing executive reports has been seen as a grueling and time-consuming process that will require many sleepless nights to get the job done right.
While there is plenty of truth to this, modern automated reporting software has revolutionized these writing nightmares.
Databox is one of those tools.
With Databox, you will be able to connect data from multiple sources into one comprehensive dashboard. Also, you are going to gain access to different types of charts and graphs that you can use for data visualization and make the report much more understandable to the readers.
Using a modernized tool like Databox will provide you with a faster, more accurate, and more efficient reporting process.
This advanced software allows you easily create your own customizable reports that can be adjusted in real-time as soon as new data emerges.
Who says executive reporting has to be a tedious process? Sign up for our free trial and see how easy creating executive reports can be.


