Table of contents
To make informed financial decisions in your company, you first have to be, well, informed.
Understanding the financial activity of your company sets the foundation for identifying good business opportunities and making the right decisions to ensure future growth.
By tracking, organizing, and analyzing financial performances, you will have a clearer picture of where the money is going and where it’s coming from. No wonder finance is one of the most monitored and reported operations, according to Databox’s State of Business Reporting.
As financial data grows more complex, many teams now use AI data analysts, like Databox MCP, to ask direct questions about performance and get answers based on their actual metrics, definitions, and historical data. Instead of manually digging through reports, you can ask why revenue dipped last quarter or which expenses increased fastest, and get a clear explanation grounded in your numbers. This makes financial reporting more useful in practice, since teams can quickly interpret trends, understand what changed, and make decisions based on reliable context rather than surface-level figures alone.
To stay on top of numbers, companies use financial reports.
Financial reports are formal documents that capture all the significant financial activities within a business in a specific period.
While these reports are extremely useful for you and your key stakeholders, you won’t be the only one reaping the fruits. Financial statements are also examined by potential investors and banks since they provide them with enough insight to determine whether they want to invest in your business.
In this article, we are going to walk you through what financial reports are, why they are significant and show you a step-by-step guide that will take your financial reports and business reporting as a whole, to the next level.
- What Is a Financial Report?
- What Is the Purpose of Financial Reporting?
- What Are the Types of Financial Reporting?
- How to Write a Financial Report?
- Finance Report Examples
- Improve Financial Reporting with Databox

What Is a Financial Report?
Financial reports are official company documents that showcase all the financial activities and performances of your business over a specific period. Usually, they are created on a quarterly or yearly basis.
Every business is legally obliged to use financial reporting to display its current financial status and organize financial data.
The documents are available for public view which means that potential banks and investors will most likely analyze them before they decide to work with you and invest in your business.
They are also important for tracking future profitability estimates, business growth, and overall financial health.
At bottom, financial reports provide you with insight into how much money you have, how much did you spend, and where it is coming from. Based on the data within the report, you can make informed business decisions and create plans for future spending.
The key things a financial report should include are:
- Cash flow data
- Asset and liability evaluation
- Shareholder equity analysis
- Profitability measurements
Related: Quarterly Business Review: How to Write One and How to Present It Successfully
What Is the Purpose of Financial Reporting?
Financial reports are used to track, analyze, and display your company’s cash flow.
Understanding how your business is performing from a financial standpoint can seem like an impossible task without these reports.
However, financial reports aren’t used only because they are practical; you are legally required to include them.
Here are some of the main ways in which financial reports can help your business:
- Communicate essential data
- Monitors income and expenses
- Supports financial analysis and decision-making
- Compliance
- Simplify your taxes
Build automated reports and make better decisions
Report what happened, what changed, then talk about what to do next.
Communicate essential data
Having an insight into the current financial situation of your business is important to each high-ranking member of the company (stakeholders, executives, investors, and partners).
You will use this financial data to create budget plans and monitor the company’s overall performance. When you establish an open communication and transparency policy within your business, you are more likely to attract new investors and enhance funding.
The information communicated in financial statements is what investors rely on when they are assessing risks, profitability, and future returns.
One way to gain the trust of investors is to showcase how your financial performance stacks up against your peers. For example, by joining this benchmark group, you can better understand your gross profit margin performance and see how metrics like income, gross profit, net income, net operating increase, etc compare against businesses like yours.
For example, you can discover that the median gross profit a month for B2B, B2C, SaaS and eCommerce is 73.79K. If you perform better than the median, this might be a good incentive for your investors to increase your funding.
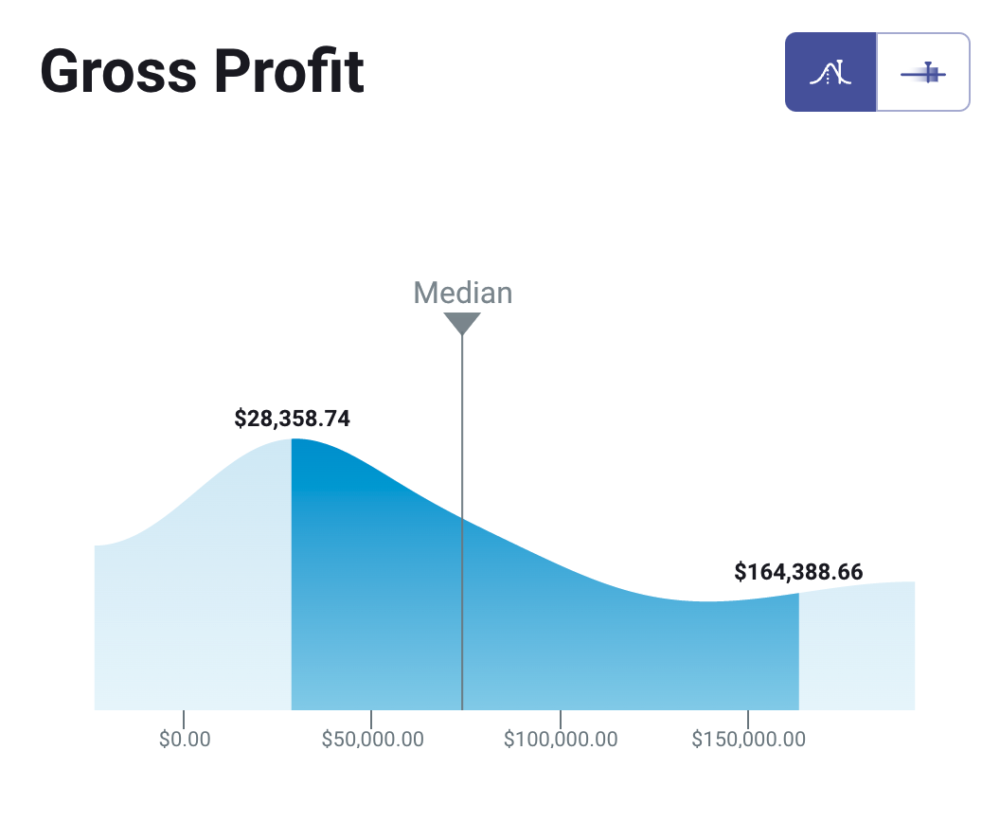
*Important note: Databox Benchmark Groups show median values. The median is calculated by taking the “middle” value, the value for which half of the observations are larger and half are smaller. The average is calculated by adding up all of the individual values and dividing this total by the number of observations. While both are measures of central tendency, when there is a possibility of extreme values, the median is generally the better measure to use.
Benchmark Your Performance Against Hundreds of Companies Just Like Yours
Viewing benchmark data can be enlightening, but seeing where your company’s efforts rank against those benchmarks can be game-changing.
Browse Databox’s open Benchmark Groups and join ones relevant to your business to get free and instant performance benchmarks.
Monitors income and expenses
Financial reporting involves tracking incomes and expenses for a specific time period. To establish efficient debt management and budget allocation, you will need an insight into the most important spending areas.
By tracking income and expenses, you will also understand current liabilities and assets. Analyzing financial documentation will provide you with a bigger picture regarding the key metrics such as debt-to-asset ratios that investors use to calculate potential profitability.
All of this is information is crucial for staying ahead of your competitors.
Related: How to Write a Great Business Expense Report: A Step-By-Step Guide with Examples
Supports financial analysis and decision-making
The performance analysis in financial reports is what you rely on to make better business decisions.
Considering the different data that financial reports include, you can check out real-time information regarding historical performances, key spending areas, and use them to create accurate financial forecasts.
Implementing detailed financial analysis and using developed data models can help any business better evaluate current activities and make future business growth decisions.
You will be able to recognize trends, potential problems, and stay on top of your financial performances in real-time. This sets the foundation for quick and accurate economic decisions.
Compliance
The main purpose of financial reports is to make sure your business is in compliance with the law and regulations of government agencies.
Regulatory institutions examine every document that evaluates the financial activities of your company. This is why making accurate financial documentation is crucial for the well-being of your business.
Aside from accuracy, you will also have to follow certain deadlines that these institutions set. This sometimes causes pressure in accounting departments to create complex financial reports quickly and accurately, which is why regular bookkeeping is immensely important.
In the US, private and public companies have to be compliant with the GAAP (Generally Accepted Accounting Principles), while international companies mostly report under the IRFS (International Reporting Financial Standards).
Both of these organizations provide some standard guidelines but there are a few differences you will have to pay attention to when creating your financial statements.
Simplify your taxes
No matter how big or small your business is, doing taxes can be a stressful task.
By creating accurate financial reports, you can make tax calculation a lot easier since you will minimize any chances of error and save time by including all financial data in one document.
Not only that, since financial reports are a legal requirement, the IRS uses them to evaluate the tax income of each individual company.
What Are the Types of Financial Reporting?
While financial reports all have the same goal, there are a few different types that you should know about.
This isn’t only a matter of compliance or best practice, these reports are key for understanding the different segments of cash flow.
Here are the main types of financial reporting:
Balance Sheet
A balance sheet is a financial statement that tracks the total amount of assets, liabilities, and shareholder equities within your company. They also provide you with a real-time evaluation of asset liquidity and debt coverage.
Most companies create balance sheets on a quarterly basis and include the data from each quarter in the annual report.
When creating a balance sheet, there is an asset page (includes available cash, equipment value, inventory value, etc.) and a liability page (includes accounts payable, credit card balances, bank loans, etc.) that you need to fulfill.
Once you total these assets and liabilities, you will subtract liabilities from the assets. The amount you get is what is called ‘owner’s equity’.
Cash Flow Statement
This is a financial statement that records all the different cash flow activities in the company.
Cash flow statements track cash generated and cash spent amounts in a specific time period. This report is crucial for measuring whether companies generate enough cash to cover their debts. Also, it provides insight into fund operations, investments, and the overall activities that are generating revenue.
This statement is helpful for investors since they can use it to determine whether your business presents a good investment opportunity.
While balance sheets incorporate certain calculations to determine financial values, cash flow statements are consisted of three main elements:
- Operational activities – inventories, wages, tax income, accounts receivable, accounts payable, and cash receipts
- Investment activities – investment earnings use, investment earnings generation, asset sales, issued loans, payments from mergers
- Financing activities – payable dividends, debt payments, debt issuance, cash from investors, and stock repurchases
Income Statement
The income statement records the company’s expenses, revenue, and net loss/income over a specific time period.
Balance sheets focus on the current activities and performances while income sheets track them over a longer period. Businesses tend to track income statements each quarter to gain better insight into the different financial processes that occur.
Income statements include profits and losses, which is why they are also called P&L statements (Profits & Losses).
The main elements included on the income statement are:
- Operating revenue – financial data regarding sales of products or services
- Net and gross revenue – includes the total sales revenue and remaining revenue (after the cost subtraction)
- Primary expenses – these include general costs, administrative costs, depreciation and selling, and COGS (cost of goods sold)
- Secondary expenses – capital loss, asset loss, debt interest, and loan interest
- Nonoperating revenue – this is revenue that comes from accrued interest, it includes investment returns, capital gains, and royalty payments
Shareholder Equity Statement
Even though shareholder’s equity is usually included on the balance sheet, larger companies tend to report these activities on a separate statement.
This statement tracks the amount of money key stakeholders invest in the business. The investments most commonly include company stocks and securities. After dividends are released to stockholders, the retained earnings in the company change.
Stakeholder equity statement includes these key components:
- Retained earnings after dividends and losses have been subtracted
- Common/preferred stock sales
- Purchased treasury stock
- Generated income (including the income that comes from unrealized capital gains)
Pro Tip: How to Stay on Top of the Financial Health of Your Business
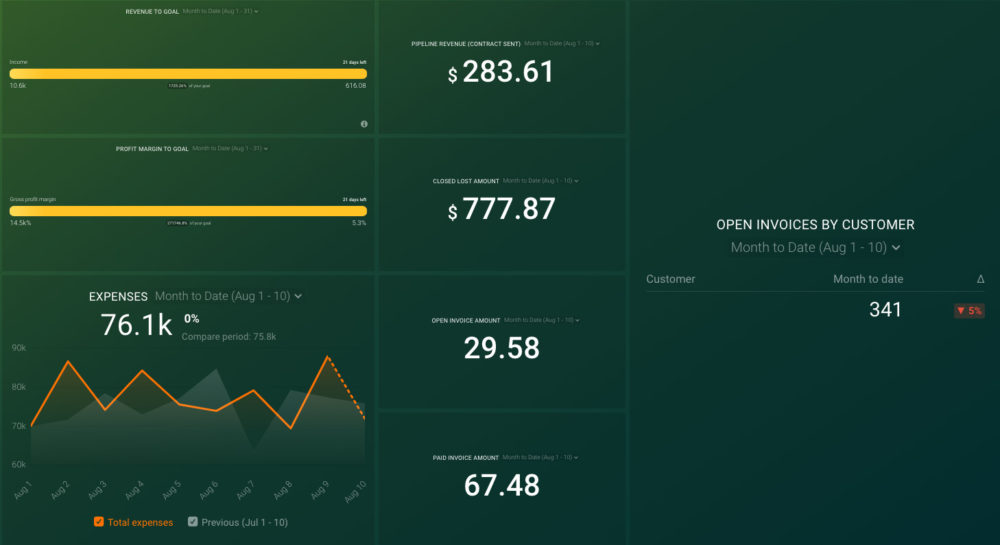
Do you own and manage a small business? Then you know how much of a struggle it can be to stay on top of the financial health of your business on a daily basis. Now you can pull data from QuickBooks and HubSpot’s CRM to track your key business metrics in one convenient dashboard, including:
- Open deals and deal amounts by pipeline stage. Get sales data directly from your HubSpot CRM and track deals, deal amounts, deal stages, and dates from your sales pipeline.
- Key financial data. Track gross profit margin, open invoices by amount and by customer, paid invoices, expenses, and income from QuickBooks.
Now you can benefit from the experience of our HubSpot CRM and QuickBooks experts, who have put together a plug-and-play Databox template that helps you monitor and analyze your key financial metrics. It’s simple to implement and start using it now!
You can easily set it up in just a few clicks – no coding required.
To set up the dashboard, follow these 3 simple steps:
Step 1: Get the template
Step 2: Connect your HubSpot and Quickbooks accounts with Databox.
Step 3: Watch your dashboard populate in seconds.
How to Write a Financial Report?
Financial reports help you understand your company’s financial performance, attract potential investors, and are legally required. This is why you have to make sure that they are as accurate as possible.
You want your financial reports to be comprehensive, understandable, and precise.
Even though creating a good financial report can be very complex, we are going to show you a step-by-step guide that will make the whole process much easier.
Follow these steps to create a great financial report:
- Step 1 – Make a Sales Forecast
- Step 2 – Create a Budget for Expenses
- Step 3 – Create a Cash Flow Statement
- Step 4 – Estimate Net Profit
- Step 5 – Manage Assets and Liabilities
- Step 6 – Find the Breakeven Point
Step 1 – Make a Sales Forecast
When making a sales forecast, the first thing you should do is create a spreadsheet that includes your sales performance from the last three years.
Use a specific section for each line of sales and organize columns for each month of year one. For years two and three, organize columns on a quarterly basis.
Create three different blocks – one for pricing, one for unit sales, and the third one for multiplying units by unit cost (to calculate the cost of sales).
Cost of sales is important because it helps you calculate a precise gross margin.
Once you do the math, you can make an accurate sales forecast that is backed up by historic financial data.
PRO TIP: If you are using HubSpot CRM to visualize your sales data, watch the video below to learn how to set up and track your HubSpot CRM data in order to more accurately forecast your sales this month, quarter, and beyond.
Step 2 – Create a Budget for Expenses
Once you have made a sales forecast, you will want to calculate how much it will cost you.
When creating an expense budget, you should include both fixed costs (rent, payroll, etc.) and variable costs (marketing and promotional expenses). Costs such as interest and taxes can’t be completely accurate, so you are going to have to make rough estimates.
For taxes, you can multiply the estimated debt balance by your estimated tax percentage rate.
To estimate interest, multiply your estimated debt balance by an estimated interest rate.
Step 3 – Create a Cash Flow Statement
We already mentioned what cash flow statements are and why they are so important for your business. They are typically created based on the sales forecast, balance sheet components, and other estimates.
To make cash flow estimates, companies should use historical financial statements. If your business is relatively new, you should project cash flow statements by breaking them down into 12 months.
Your way of invoicing is also linked to cash flow estimates.
For example, if a customer has the right to pay for your services after 30 days, the cash flow statement will show that you only collected 80% of your invoices within the month (while you need 100% to cover the expenses).
Step 4 – Estimate Net Profit
To estimate net profit, you should use the numbers from your sales forecast, expense estimates, and cash flow statement.
You can calculate the net profit by subtracting expenses, interests, and taxes from the gross margin.
This step is extremely important since it serves as a profit and loss statement that helps you create a detailed business forecast for the next three years.
Step 5 – Manage Assets and Liabilities
In order to estimate your business’s net worth at the end of a fiscal year, you have to be able to manage assets and liabilities that won’t be shown in the profits and loss statement.
Come up with a rough estimate of how much money you expect to have on hand each month and include accounts receivable, inventory, land, and equipment.
After that, calculate liabilities, debts from outstanding loans, and accounts payable.
Step 6 – Find the Breakeven Point
You know that you have found a breakeven point if your business expenses are in line with the sales volume.
The three-year income estimation should help you acquire this analysis. In viable businesses, the total revenue should exceed total expenses.
For potential investors, this kind of information is crucial since they want to be reassured that they are investing in a company with steady growth.
Finance Report Examples
Nowadays, most companies use different tools and templates to make their reporting process easier. Using dashboards can help you track the metrics you obtain from the financial management tools that your business integrates.
Databox offers pre-built financial templates that can help you track the most important financial metrics in one place.
With our comprehensive dashboards, you can follow the most significant numbers and later include them in your financial report, making the whole process less time-consuming.
We understand that each business is different, which is why you can also customize the reports in any way you deem fit and at any time.
Here are some of our most popular financial reports that you can try out:
- Quickbooks Profit and Loss Overview Dashboard
- Xero Profitability Overview Dashboard
- Stripe (MRR & Churn) Dashboard
- Profitwell Revenue Trends Dashboard
- PayPal (Account Overview) Dashboard
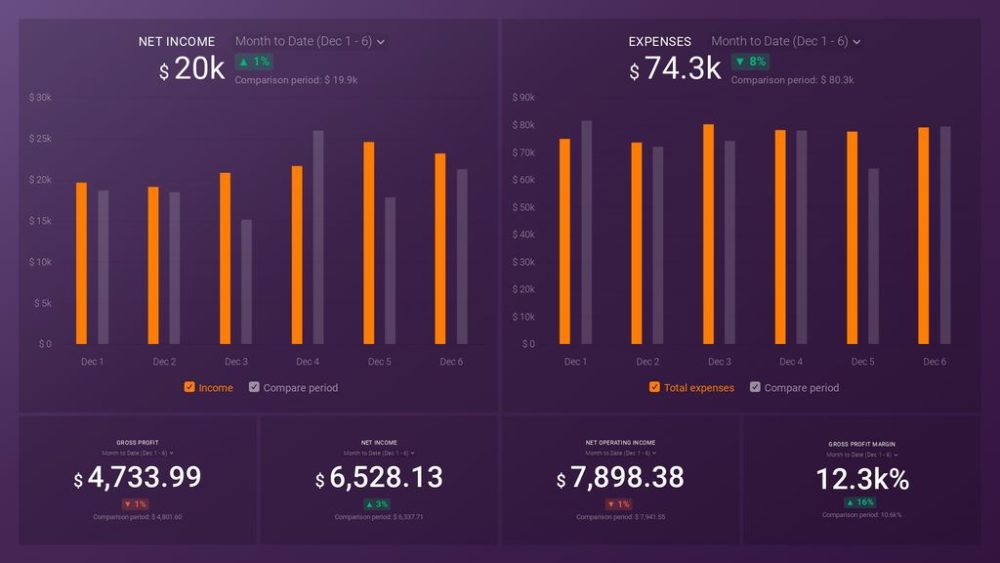
QuickBooks Profit and Loss Overview Dashboard
To gain valuable insight into the sales and expenses that incur in your business, you can use the QuickBooks Profit and Loss Overview Dashboard.
Make sure you are staying on top of your numbers by tracking monthly, quarterly, and yearly income. Also, this report will help you figure out how profitable your company is and which areas may need to be fixed.
Some of the key metrics you can follow are net profit, income by month, expenses by month, and profit margin.
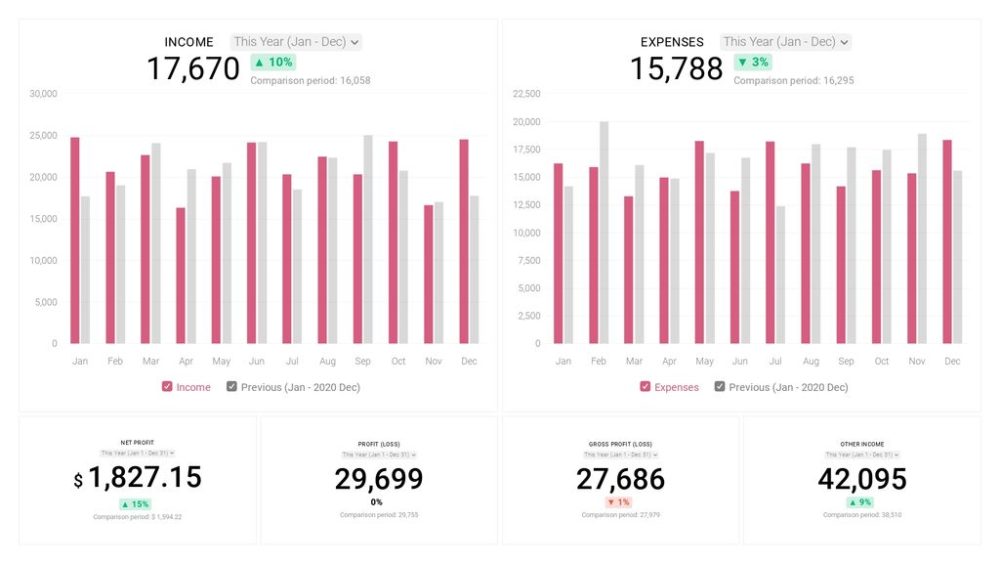
Xero Profitability Overview Dashboard
Xero is one of the most popular accounting systems that companies use to manage their financial positions. However, it can sometimes be hard to organize the large amount of data this tool provides.
This is where the Xero Profitability Overview Dashboard can come in handy. This customizable template will provide you with a comprehensive view of the sales and expenses that go into your Xero system.
Once the time comes for creating a financial report, you can simply integrate the data you gathered in this dashboard.
The key metrics it includes are net profit, income by month, expenses by month, profits, losses, gross profit, and other income.
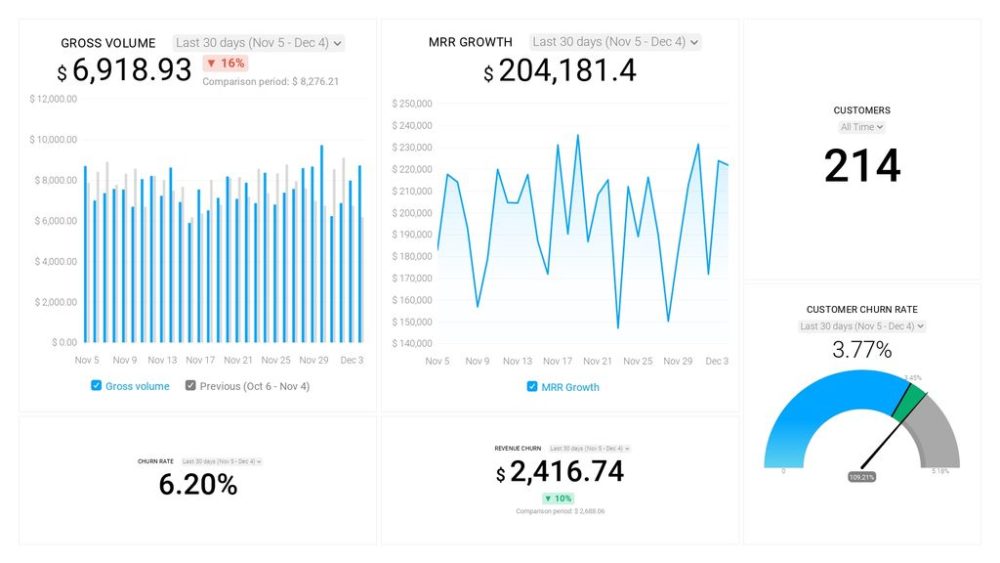
Stripe (MRR & Churn) Dashboard
Use the Stripe Dashboard to monitor your churn rate and track MRR growth in real-time. Also, you can check how many customers your business currently has at any given time.
Once you connect your Stripe account to this template, you will be able to answer these questions:
- How much money did I make through sales today?
- How can I track my MRR (Monthly Recurring Revenue)?
- How many active customers do we have?
- How much revenue did I lose from churned customers?
Some of the metrics you can visualize are churn rate goal, customer churn rate, gross volume, revenue churn, and customers.
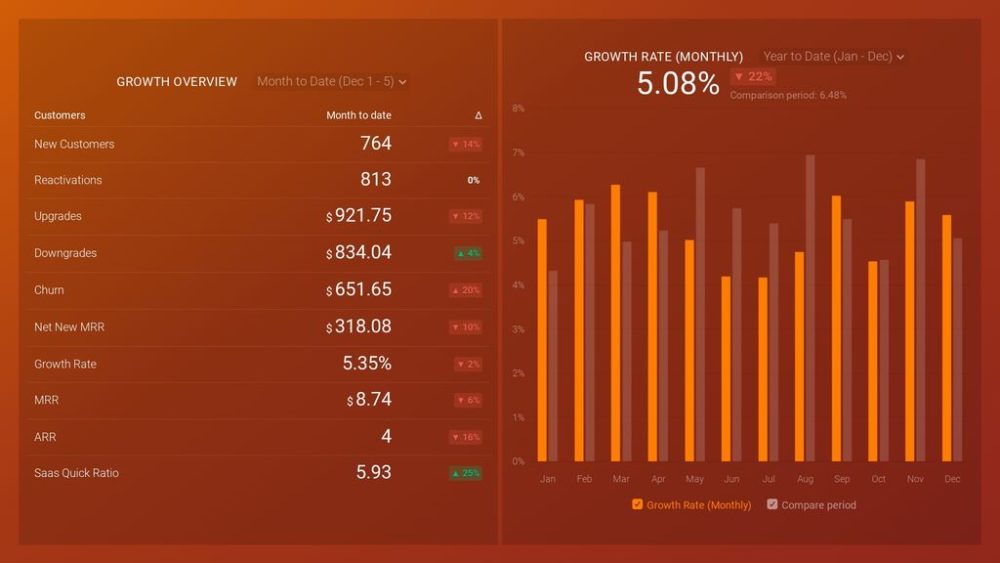
Profitwell Revenue Trends Dashboard
Profitwell Revenue Trends Dashboard allows you to monitor all the incoming sources of revenue for your SaaS business and keep track of the important churn metrics.
You can use this template to see how fast your business is growing. The SaaS metrics will all be located in one comprehensive dashboard and you can visualize all the data with only one click.
Also, you can compare revenue from upgrades and downgrades and investigate your churn ratio revenue.
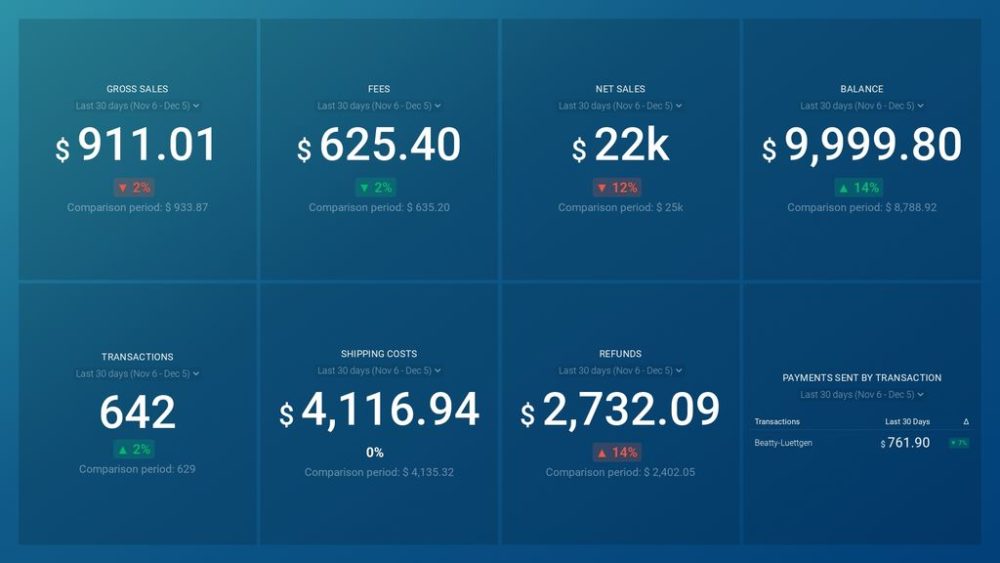
PayPal (Account Overview) Dashboard
The PayPal Account Overview Dashboard is extremely useful for bigger companies who want to have a clear overview of their payments, refunds, sales, and other key metrics that your business relies on.
Connecting your PayPal account to the template can be done in a matter of minutes and you will get the answers to questions such as:
- How can I track gross sales?
- What is the best way to calculate net sales?
- How much did I spend on PayPal fees in the previous month?
- How can I check my PayPal account balance?
- How much money was returned through refunds last month?
Streamline Financial Reporting with Databox
Since the financial reports you create will be examined by both government agencies and potential investors, you will want to make sure that they are top-notch.
However, the reporting process can sometimes feel a bit overwhelming and you will face a lot of pressure trying to create the perfect report.
Databox can help relieve this stress and enhance your financial reporting skills.
No matter if you create these financial statements quarterly or annually, you will end up with a handful of data to analyze. With financial reporting software such as Databox, this analysis process will become both simpler and quicker.
With our customizable dashboards, you can visualize all the most important data and gather it in one place. Aside from being visually pleasing, your reports will also be much more engaging and minimize any chances of error since the information will be imported directly from your financial management tools.
To satisfy both your company’s key stakeholders and potential partners, you can sign up here for a free trial and put your financial reporting on autopilot.