Uses one-click integrations:
-
 PayPal
If you don't use PayPal, you can pull data from any of our 130+ one-click, native integrations or from spreadsheets, databases and other APIs.
Try this dashboard for freeWhat you’ll learn from this PayPal Account Overview Dashboard Template:
Connect your PayPal account and learn:
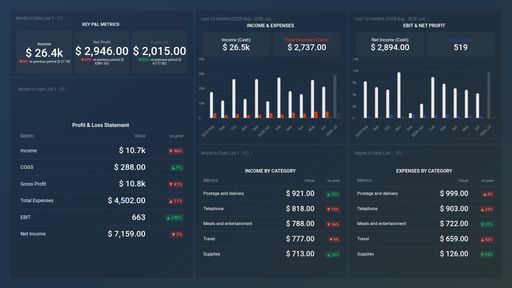
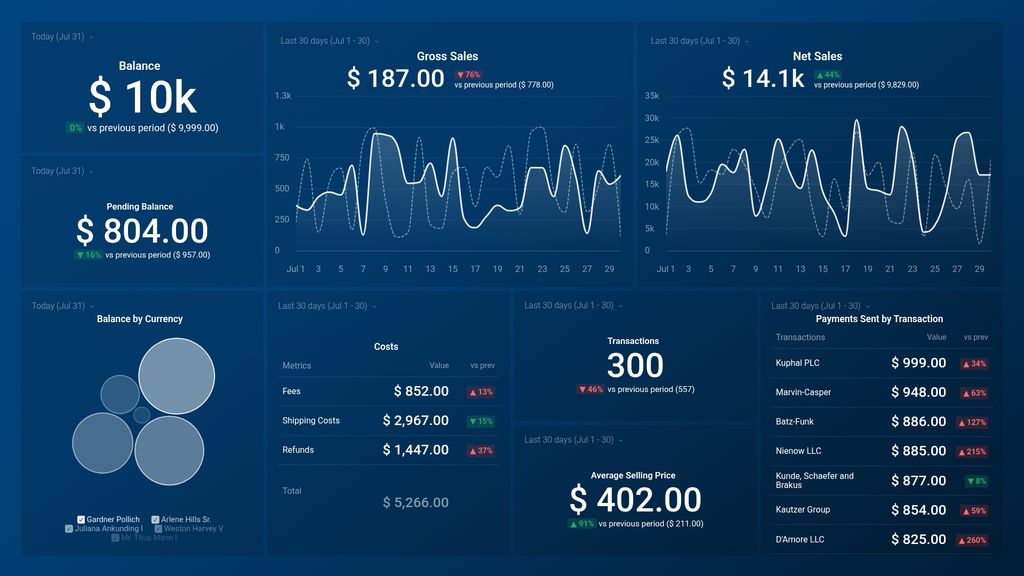
- How do I track gross sales? See the total amount of money you earned within a given time period from all sales transactions before any deductions were made, such as sales returns, taxes, shipping, discounts, etc.
- How do I calculate net sales? Find out how much monetary value you made from the sale of your products and/or services during a time period. Your net sales are what you have after excluding costs such as sales returns, taxes, shipping, discounts, etc.
- How much was I charged in PayPal fees last month? View the total amount of money you were charged for selling your products and/or services. Additionally, see how much in fees you had to pay for sending or receiving money to/from an international destination, for withdrawing money, processing customer refunds, etc.
- How do I check my PayPal account balance? Quickly and conveniently check your PayPal account balance at one glance.
- How do I track all online transactions? Track and visualize the total number of transactions you processed from confirmed sales within a specified date range. Additionally, keep track of the payment sent for each transaction.
- How do I calculate shipping costs? Track and manage the costs associated with shipping for your online business. It is important to pay attention to this data to learn how much courier services are charging you and if the cost has increased over time. Note that if your shipping costs are too high, it can deter customers from buying from you (high abandoned cart rate).
- How much in refunds were issued last month? Track and manage your refund payments to customers in real-time. See how much money you refunded your customers after returning their purchased items (depending on your refund policy).
Pull additional data using our deep integration with PayPal
What else can you track and visualize with our robust integration with PayPal? When it comes to your most important payment and sales metrics, almost anything:
- Total sales, Net sales, Gross sales
- Transactions by type
- Cashflow
- Churn rate
- Net profit and Gross profit
- Payment conversion rate
There are many metrics and metric combinations you can track using PayPal. And in Databox, you can quickly visualize dozens of PayPal metrics & KPIs in various ways:
Read more about Databox’s PayPal integration.
Explore more PayPal dashboards.
PayPal metrics included in this template
-
Average Selling Price
The Average Selling Price is a metric that measures the average price at which goods or services are sold in a given period. It helps to track the pricing trends of products and can inform business decisions.
-
Balance
The Balance metric in PayPal refers to the amount of funds available in a user's account, which can be used to make payments or withdraw to a linked bank account.
-
Balance by Currency
The Balance by Currency metric displays the sum of available funds in different currencies on a PayPal account. It allows users to have an overview of their account balance in specific currencies for easy management and tracking.
-
Gross Amount (Payments Sent) by Transaction
The Gross Amount (Payments Sent) by Transaction metric refers to the total amount of money sent by a seller to a recipient, before any fees or discounts are deducted. It helps track the total revenue generated by each transaction.
-
Fees
Fees are the charges assessed by PayPal on transactions, including currency conversion fees, cross-border fees, and merchant processing fees. They are determined based on the type of transaction and the parties involved.
-
Net Sales
Net Sales is the total revenue generated by a business or organization after deducting any returns, discounts, and allowances from the gross sales.
-
Pending
Pending is a temporary state for transactions in PayPal where the payment is being reviewed or verified before it can be fully cleared and completed.
-
Refunds
The Refunds metric measures the total amount of money refunded to buyers for transactions processed through PayPal. It is used by sellers and businesses to track the frequency and value of refunds issued and manage their cash flow accordingly.
-
Shipping Costs
Shipping Costs is a metric that measures the amount of money spent on shipping and handling for each transaction processed through PayPal. It helps sellers track their shipping expenses and adjust their pricing strategies to ensure they are providing a cost-effective shipping experience for their customers.
-
Gross Sales
Gross Sales is the total amount of revenue generated by a business before any deductions or expenses. It includes all sales, refunds, and chargebacks.
-
Transactions
The Transactions metric tracks the number of completed payments or purchases made through PayPal within a certain time period. It helps businesses understand their sales volume and customer behavior.