


")
Table of contents
Sales is one of the top 3 most monitored and reported operations, according to Databox’s state of business reporting. Monitoring the correct sales reports helps you course-correct before it’s late while doubling down on what’s working.
Put simply, having the data that these sales reports summarize can help you run a revenue-generating sales show.
The only catch: you can’t track every other sales metric or set up every other sales report that you can think of. That’ll be too much of a data flood.
So what are some of the top sales reports that you should be tracking? We’ll answer that for you in this guide. Along the way, we’ll also give you the 411 on sales reports, which means there is lots to learn today. A quick look:
- What is a sales report?
- What should be included in a sales report?
- Which sales reports should you create?
- What are the most helpful sales report templates?
- Measuring sales performance in Databox
What is a Sales Report?
A sales report allows you to aggregate and report on data to track your sales progress for a pre-defined duration. You can track specific metrics for whatever frequency – daily, weekly, monthly, or another – more on this in a bit.
Think of these reports as insider peeps into your sales and team performance. Use them to get an idea of how well your team and overall sales are doing. You can also use the data to tweak strategies and allot resources.
Sales reports can be created manually in Excel or Google Sheets, automatically within your CRM such as HubSpot CRM, Pipedrive, Zoho CRM, or Freshsales, or through dashboard reporting tools like Databox.
Of these tools, the majority of folks we talked to use Google Sheets to create their sales reports. Others use HubSpot CRM and Salesforce (in that order).

What Should Be Included in a Sales Report?
The exact metrics to include in a sales report depend on what the report is tracking, your sales goals, and the report’s audience.
For example, the metrics that your CEO cares about are very different than the metrics your SDRs will need to know. Cayley Vos of Netpaths agrees, “Your audience will determine how a sales report is designed.
Information that would appeal to the board will be different than data the CMO needs to see to make marketing decisions.”
So how do you decide which metrics to add to your report? ”Determine the key points you want to highlight and start the report with these numbers,” Vos suggests. “The rest of the report will provide support for the main key results featured. This allows the report to be readable and usable by technical and non-technical people in the company.”
Ideally, “the strongest sales report templates are both simple to digest yet robust in the information they provide,” Jenny Kelley of Kiwi Creative points out.
“At Kiwi Creative, we use a specific template that can be read from the top-down. We start by:
- Stating our reporting period’s key objectives.
- Below, we break out our KPIs into weekly, monthly, and quarterly goals that we report based on a targeted value, actual value, and the difference.”
“Our template consists of just numbers, but since they relate to specific KPIs, we can see how our sales strategies are performing,” Kelley explains. “Plus, since our KPIs are listed row-by-row, we can add more columns to track these three reporting points month-by-month to see how successful our optimizations are.”
That said, here are some metrics that you may want to track:
- Closed Won or the total number of deals closed-won during a specified date range.
- Closed Lost or is the total number of deals closed lost in a specified date range. It can be helpful to segment this by individual salespeople. For example, if you see a salesperson who is struggling to close as many deals as everyone else, you can coach them.
- Deals Created which is the total number of deals created in a specified date range.
- Sales Forecast. A sales forecast allows you to estimate the number of new deals created and won in a given week, month, quarter, or year.
- Deal Conversion Rate that gives the number of New Contacts divided by the number of Sessions during the specified Date Range split up by Sources. Daily totals are not available for this metric. Instead, the total current value of this metric will be visualized cumulatively. No historical data is available from the initial connection.
- Average Deal Size which is the average time it takes to close a deal in your sales pipeline.
- Churned Customers or the number of customers who cancel in a given time period. For example, if you try a new sales campaign and notice that many customers churn in the first 90 days, you’ll want to evaluate your sales messaging and tactics to ensure that you are going after the right type of customers.
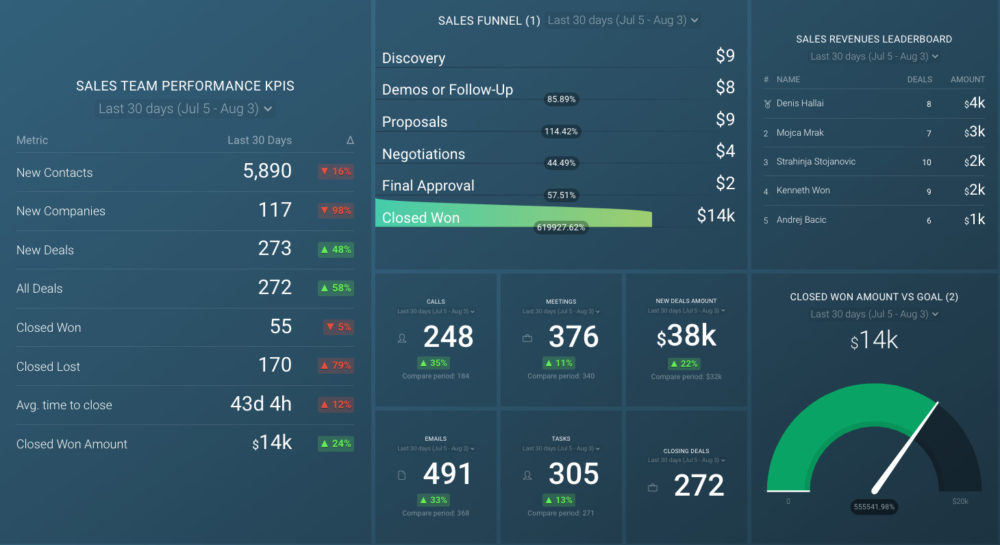
PRO TIP: Monitor Your Sales Team’s Performance in One Dashboard
Smart Sales Managers know that to achieve your monthly and quarterly goals, you have to monitor your team’s sales performance on a daily, weekly, and monthly basis. To do that, you need an actionable dashboard that summarizes both team and individual sales rep metrics and allows you to:
- Understand the current sales pipeline.
- Track sales rep performance.
- Compare team results to revenue goals.
If you use the HubSpot CRM, you can benefit from the experience of our sales experts, who have put together a plug-and-play Databox template showing some of the most important metrics for monitoring your sales team performance. It’s simple to implement and start using as a standalone dashboard or in sales reports!
You can easily set it up in just a few clicks – no coding required.
To set up the dashboard, follow these 3 simple steps:
Step 1: Get the template
Step 2: Connect your HubSpot account with Databox.
Step 3: Watch your dashboard populate in seconds.
Which Sales Reports Should You Create?
Now that you know what sales reports are and what to add to them, how often should you create them?
You can choose from daily, bi-weekly, weekly, monthly, quarterly, and annual sales reports. Of these, monthly reports are the most popular as 78.3% of our respondents use them.
Weekly reports are also pretty popular as 69.6% use them. 43.5% also create quarterly sales reports with 39.1% using yearly reports. 30.4% also have daily sales reports.

Based on the experiences of Spyic’s Katherine Brown too: “The most common templates for sales reports are daily, weekly, monthly, quarterly, and yearly.”
“These reports generate basic statistics such as the volume of orders received in a given period or the average price of an item sold in a given period. It would also be possible to use these reports to make more detailed statistical analyses. For example, to compare prices across time.”
Related: Sales Volume: Why It Matters and 12 Ways to Increase It
“Another common type of template is a regular sales report,” Brown explains. “The most common type of regular report is a weekly report. Some templates refer to the year as a whole, such as annual, monthly, and quarterly reports. These must be designed for an entire year rather than for a specific quarter or month.”
“Finally, some templates refer to the month; these must be for monthly reports only,” Brown says. “Regular reports are automatically generated using a spreadsheet program. This type of report can be helpful if users need the data but do not have the time to develop it themselves or if their computer is prolonged.”
Stephen Curry from CocoSign makes an important observation about sales reports’ frequency. Curry points: “One week can be said to be the perfect unit of time to measure the performance of individual sales representatives.”
“The one-month time frame is usually too long, causing you to miss course correction opportunities before the event,” Curry notes. On the other, “A day is often too short to see any real and meaningful information about the results.”
Marilyn Gaskell of TruePeopleSearch agrees. In their company, they “use weekly sales reports to keep track of our customers and the progress we are making, along with the effort that goes into making this progress.”
And, here’s the interesting bit: “using these weekly sales reports, we then make a sales report for the whole month consolidating the data in each weekly sales report.
For our weekly sales report, we focus on the following data:
- Sales by channel: methods acquired by customers to identify the one that generates the most revenue
- Lead to opportunity ratio: assess the number of non-conforming and verified leads
- Lead conversion rate: number of potential customers that become actual customers
- Opportunity ratio: the effect of each employee when giving up opportunities”
Tim Absalikov from Lasting Trend also favors weekly reports, particularly, for monitoring sales reps’ performance they share. “It is useful to keep an Employee Weekly Progress Report to keep track of what was done for the week, to note all the successes and difficulties, especially if the employee works remotely.”
“It is useful to categorize tasks [into]:
- completed tasks
- current tasks
- tasks for the next week.”
By tracking these metrics, Absalikov says you can “identify which tasks are prioritized, which projects are taking too long, and which metrics or targets need more attention.”
I Over Golf’s Scott Ferguson, however, finds daily reports useful. Speaking in their favor, Ferguson highlights: “All the mentioned templates are important but the most useful is the daily sales template. This is because it tells you about respective insights that weekly, monthly, and quarterly insights won’t tell you.”
“Daily sales template digs into details which is what you need in formulating better marketing strategies.” For example, “the daily sales template allows you to see up close:
- The time they made the purchase
- How often they make a purchase and
- On which days people mostly purchase.
These data are sometimes blurred in other templates, however, important they seem,” continues Ferguson. “With the daily sales template, you have the time to instead focus on details rather of simply focus on the fluctuating sales.”
What’s more, “Through other templates, you can see the fluctuating sales but with the daily templates, you can know why they’re fluctuating.”
Ultimately, however, the correct reporting frequency is the one that suits you best. As Curry puts it: “the best time to measure the performance of sales representatives depends on your business model.”
Most Helpful Sales Report Templates
Now, for the meaty part – a list of the sales reports, broadly divided into:
Of all these reports that you’ll learn about below, our respondents say the leads vs. sales report template is the most useful for them.
Click to leads and deals closed vs. goal sales reports tie at the second spot for the most useful reports. These are followed by sales pipeline, multiple sales pipeline, gross profit margins, and sales performance comparisons that are all equally important following the top three.

With that, let’s dive into the details.
Related: 29 Sales Tips for Improving Your Close Rate
Daily Reports
Track and visualize the following sales KPIs and metrics on a daily basis in your sales reports:
1. Number of meetings and rep talks
Rishika Patel from WriteCream recommends creating a sales report that shows the number of meetings established by individual sales reps.
“While in reality, you cannot force a potential customer to organize a meeting with you, you can control the number of meetings you organize,” Patel shares. “Note that we do not track telephone calls and/or send e-mails explicitly, as these KPIs can easily manipulate the effort.”
2. Total daily turnover report
Patel also shares the total daily turnover sales report as an important template to track.
“This is one of the clearly defined daily reports focusing on the daily number of sales. Especially in the retail sector, it’s very important to track since everyday volumes can show what days of the week work best and how you can take advantage of them.”
3. New daily leads report
Next up is the daily leads report that Eden Cheng from PeopleFinderFree suggests.
“The number of new leads built by the rep is a pretty straightforward daily sales report,” Cheng notes. “In case you are fretting over the reps boosting their numbers with poor quality leads, you can efficiently ascertain definite qualifications for leads and, therefore, base your report on those numbers.”
This data can be obtained using this sales leads dashboard.
4. Number of sales opportunities
Ben Wallington from Designerwear opines the number of sales opportunities report is a great one.
The reason? Wallington shares two:
- “It tells you which days of the week your target customers respond well to sales calls
- “It helps you identify problems”
Regarding the second point, Wallington shares an example to explain. “If a sales call went well but the customer did not make a purchase, there may be something in the way that you need to look into.”
Similarly, about the first point: “if sales opportunities are higher on certain days compared to others,” Wallington observes “you will get a general idea of the days that you are more likely to make sales.”
5. Number of outbound calls by reps
“You can monitor each of your representatives’ outbound calls on a daily basis and see how effectively they work and take appropriate measures if there are major deviations from set objectives,” Patel from WriteCream shares the benefit of this daily report.
This translates to “How many telephone conversations and meetings are held each day by each representative” according to Patel.
“Again, everything else is equal, because a representative who spends more time talking to customers will yield more results than a representative who doesn’t. This assumes that you qualify your leads correctly, which can be said more easily than done sometimes,” Patel outlines.
Come to think of it: the more you get down in the trenches, the more you learn. In fact, the more reps talk to prospects, the better they can understand consumer psychology by paying attention to what helps convert leads into customers.
But Patel highlights: “this does not mean that you should provide micro-managers with a helping hand when they need to, as mentioned earlier.”
At COFORGE too, Eric Melillo shares they track outbound calls. Specifically, “we use a sales reporting template that focuses on outbound calling and contact rate per weekday,” Melillo writes.
“We don’t prescribe to cold calling. However, visitors who’ve engaged by downloading a relevant content offer will get a call. For us, outbound calling to warm prospects is an important B2B KPI that helps benchmark initial engagement activity early in the sales process,” explains Melillo.
“So, the template helps track the number of calls, repeat call attempts, days called, times called, and contact made. We’ll also set daily call targets and track performance daily, considering factors such as days of the week and local time.
Once we collect data, we’ll define not only our contact aggregate rate but also by weekdays and times. Typically, Tuesdays, Wednesdays, and Thursdays early morning produce the best results.”
Track this data actively using this call tracking dashboard.
Weekly Reports
Track these sales reports on a weekly frequency:
1. Sales volume per channel
This report shows you the number of sales you make from different channels.
Naturally, using it helps you determine which of these platforms deserves more attention for driving more sales.
James Leversha from Top Notch I.T is of the same opinion. “This is a more strategic KPI that can be used effectively over extended periods.”
“Essentially, this report will show you which physical places and client acquisition strategies bring in the most money,” Leversha notes. “The entire sales volume might help you figure out where you should focus your sales efforts so you can make adjustments. It will also show you how far you are in terms of reaching your goals.”
Put simply, it’s a report that helps you understand the performance of current sales channels. It also gives you the data to back your decision on resource allocation for lead acquisition.
2. Leads vs. sales report
The leads vs. sales report shows the comparison between your leads and sales the best in the chart form, Melanie Musson of 360QuoteLLC opines.
“If you are making twice as many leads but your sales are only increasing by 25 percent, something about the way you’re reaching people is off,” Musson observes. “You need to see both together and visualize the trend for the past year.”
OSDB Sports’ Ryan Rottman adds “I like to accurately gauge where we are when comparing leads to sales. In other words, how are we doing when it comes to closing? As this can also be a huge factor when it comes to ROI, it’s important when creating strategies and designing campaigns. Plus, you can also refer back to this report when deciding if it’s time to make any big pivots.”
Note that you can track the leads vs. sales for whatever period you want – weekly, monthly, quarterly as well as annually. As Rottman noted though, for big picture moves, you’ll need data over good time, for example, the quarter of the year.
3. Product return report
“This report shows all returned products and explains why they were returned (if there was a problem with the item),” comments Lynda Fairly of NumLooker.
Speaking about the need for this sales report, Fairly notes, “Every product requires the sales team’s attention at some point, so it is critical to track returns and analyze customer service. One way to do this is by monitoring product returns and analyzing their causes.”
“Whether you run a large or small company, the rate of return can reveal a lot about what your customers think of your products,” Fairly goes on. “The most useful sales report shows the return rate by division. When things are returned, no retailer is happy.
“Tracking and reporting these values every week will help you reduce this number in the future when you explore why the goods are being returned and what you can do to better these items or your overall offer.”
Monthly reports
Now, for the monthly sales reports to keep tabs on:
1. Sales cycle length report
Wallington calls the sales cycle report “the most useful sales report.” Why? Because “it measures the time it takes for an opportunity to become a closed sale,” they write.
Having this information is super important for understanding how long it takes to convert leads so you can design ways to speed up the process and shorten the cycle.
2. Opportunities to close rate
Ian Reynolds of OnCouse Automation explains the importance of this sales report, “If you know the cost of an opportunity and how many it takes to close one, then you can materially accelerate or improve the quality of one metric and improve your entire sales pipeline.”
Related: 11 Common Sales Mistakes to Avoid If You Want to Close a Deal
3. Customer lifetime value report
“Customer lifetime value is one of the most significant KPIs to follow in a sales report, starting on a monthly basis and gradually increasing over time,” Leversha from Top Notch I.T thinks.
“It essentially displays how much you can anticipate making per customer, and you can track it regularly to see if the average is rising or declining. The goal is to keep the lifetime value as high as possible while keeping it as long as feasible.”
Once you start monitoring this report monthly, move on to tracking it yearly. “Compare between last year and this year’s actual numbers,” says Leversha. “This will show you how much you have improved over a year.”
Moreover, “it will give you a basis on how to set your goals next year. Knowing your actual numbers and comparing them to previous years will show you what worked and what needs more improvement.”
4. Upsells and cross-sells
Since cross-selling and upselling are effective ways to increase sales revenue and grow customer loyalty to your business, this report is a must.
To add, “reporting on upsells and cross-sells is a great way to increase customer lifetime value.”
For example, Andrea Maxim of MAXIMized Business says, “We have a running Google Doc with all sales items listed that we update weekly: Total Revenue, Total # new clients, Total products sold, sales for specific products, # upsells, # refunds, and expenses.”
5. Social selling report
Lots of companies are increasingly realizing the worth of selling via social, particularly, by taking a relationship-building approach.
Case in point: ATAQ Fuel. Amy Hernandez from the team shares, “a sales report template that our company tends to follow has to be the one coming from Sprout Social.”
“This template helps to clearly identify online engagement reports and how those engagements led to our current conversion rates.”
6. Sales performance report
Another important sales report is the sales performance report.
Precondo’s Jordon Scrinko opines, “It is one of the most useful sales report templates that will boost sales by understanding whether your sales strategies give the desired results.”
“Sales Growth, Target, Acquisition Cost, and Customer Lifetime Value are common and most important KPIs for sales performance,” Scrinko writes. “Tracking Sales Performance can help you significantly improve and grow your business.”
Monitor your most important sales metrics, goals, and activities at a glance using this sales performance dashboard.
7. Sales pipeline report
One of the most valuable templates is one that allows you to see your entire sales pipeline from calls and emails to opportunities created and deals won.
“We use HubSpot and Salesforce to track sales and performance,” says Liam Barnes of Directive. “They have built-in dashboards that allow us to track calls, conversations, opportunities generated, and more. We then use Growth Hackers to track our goals.”
George Kocher of Brand North adds, “Connecting your CRM to your accounting software and then tieing that to a report that can be tracked throughout the month and updated automatically is extremely helpful.
PowerBi does this and so does Tableau. This will allow you to see your funnel. How many emails did it take to schedule an appointment? How many appointments turned into second appointments, how many second appointments turned into customers, and then what was the avg revenue per customer? This type of reporting allows you to benchmark again quarterly goals and also forecast revenue.”
Use this sales pipeline dashboard to monitor and manage your sales prospects as they move through the different stages of the buyer’s cycle.
Related: 11 Ways to Use HubSpot CRM To Manage Your Sales Pipeline
8. Financial reports
Speaking of revenue, Yana Trihub of KeyUA recommends two financial sales reports to use:
Profit And Loss Financial Report: “The profit and loss dashboard is an overview of the company’s financial statements, including the revenue earned and the net profit. It is also enhanced by various performance ratios.”
Financial Performance Report: “This template provides a detailed overview of how efficiently you are allocating your capital,” explains Trihub. “It also provides a snapshot of the main metrics of your balance sheet.”
9. Number of contact points sales reps create
It takes about eight touches before a visitor takes a desired action, say agree to an initial meeting with a rep.
It’s why Patel from WriteCream thinks it’s important you track the contact points reps make for each sale. “This is a tie-in metric, which examines how many emails were sent to a potentially interesting customer? How many telephone conversations and/or voice mails are left with potentially interesting clients?” elaborates Patel.
“With this measure, we attempt to provide each rep without making things too simple to manipulate an overall ‘effort’ KPI,” Patel writes explaining the significance of the report.
“This means that it can be useful to indicate that a prior contact with a customer has to be established to count an email or telephone conversation.”
Related: 13 Expert Ways to Measure Sales Rep Productivity
Quartely Reports
Moving on, here’s a quarterly report our contributors suggest:
Deals closed versus goals report
“The one sales report that brings the most value and insight to our team is the Deal closed vs. Goal,” says Andrea Moxham of Horseshoe + Co.
“This report will give you insight into your revenue from closed deals compared to your team’s quota or goal,” Moxham explains.
“This is useful because it allows us to evaluate our team’s performance, and it helps us set a parameter to attainable goals. Another reason why I love this report is because it helps my team stay motivated.”
Meaning: using this report will help you in three main ways:
- Setting SMART goals
- Improving sales team productivity
- Evaluating team performance by seeing how well they’re achieving their goals
Use this sales team activity dashboard to measure and compare your sales team performance and productivity at any given time.
Measuring Sales Performance in Databox
Questions like “How many leads were generated?” or “How many Deals were created?” and “How many of them are closed-won?” are part of the salesperson’s lexicon on a daily basis. The solution? Easily track and visualize your sales pipeline using these free Databox sales dashboards.
Leveraging a ‘pipeline’ as a sales tool helps you manage your sales operations, highlights your ideal conversion paths, and makes it much easier to manage and make adjustments when needed.
Let’s say you’re tracking your sales with HubSpot CRM. There are various Basic HubSpot CRM Metrics available in Databox that allow you to analyze your Pipeline Performance.
This includes “Deals Won by Pipeline,” “Deals Created by Pipeline,” “Open Deals Amount (by Stage/Pipeline),” and “Open (unclosed) Deals by Stage/Pipeline.” You can find all of them in the Metrics library.
With a sales pipeline, you’re breaking the sales process into small pieces, which means:
- They’re easier to track
- They’re easier to manage
- The goals are easier to track and pursue
You can create an overview Pipeline of all your Deals. The Data Source that we’re using here is HubSpot. The pipeline presents your sales teams’ efforts, results, and work.
You can create the Sales pipeline, even a whole Sales Databoard, with the Basic HubSpot metrics in our sales dashboard software.
Navigate to the Databoard Designer and open the Visualization Library. Drag and drop the Pipeline visualization to the Databoard.

On the right side of the Databoard, you add the metrics that you wish to display.

To show just the most relevant stages in your Deal process, add the metrics in the Databoard designer on the Right screen side. Here Calls completed, Deals created and Deals Closed won, are added.

If you have multiple Pipelines set up, you can choose the metrics “Open (unclosed) Deals by Stage by Pipeline” and “Open Deals Amount by Stage by Pipeline.”
This will expose the Dimension field, where you can select the specific Deal Stage. To filter out a specific Pipeline, type the Pipeline Name in the Dimension drop-down.

Click “+Add Row” to select the next Deal Stage to populate your Pipeline. Continue this process until you’ve added all open Deal Stages from your Pipeline.
Then include other important sales metrics to the Databoards, such as % close rate, Deals won Amount, MRR. That way, you draw a correlation between the outputs and the outcome. You can create these Overview Databoards in Databox and pull from HubSpot or other tools you may be using to track your sales pipeline.

In short, using sales reports gives you a snapshot of your sales performance while helping keep an eye on your team. Having this data by your side, in turn, assists in boosting team productivity and making data-informed decisions to grow your sales.

So what are you waiting for? Start using these sales reports for an eagle-eye view of your sales process and the people involved or create your own custom sales report with Databox.


