


Table of contents
Research shows that an average adult makes about 35,000 decisions each day, whether they’re conscious or not.
Managers, who are called decision-makers for a reason, may make even more. Their decisions directly affect the company’s finances in most cases, so it’s critical that they can rely on accurate and well-organized data, provided in a timely and easy-to-follow manner.
Do you see where we’re going with this?
When reporting to executives, you may find yourself crafting your reports a bit differently than when reporting to clients or your team. And if you’re not sure what leaders want and need to know, how you can present your data effectively, and how to tell the story behind it, this guide will help you build executive dashboards that will leave your managers at a loss for words.
Let’s get started.
- What is Executive Reporting?
- Why Is Executive Reporting Important?
- When Should You Use an Executive Report?
- How to Determine the Right Executive Report Format?
- What Should an Executive Report Include?
- What Is An Executive Dashboard?
- Benefits Of Executive Reporting & Dashboards
- Best Practices In Executive Dashboard Reporting
- Executive Dashboard Examples

What Is Executive Reporting?
Executive reporting refers to writing concise, to-the-point reports for the senior managers who need streamlined and clear data to make vital business-related decisions in order to meet the high-level goals.
There are tons of different types of reports you have to write when working for any business – internal reports that you and your team act on, financial reports, marketing reports, strategy reports, and more.
However, these may sometimes be too comprehensive and way too long for a busy manager to read them whole. These reports include a bunch of metrics and explanations that are relevant for a specific aspect of a business or a particular team, but not for C-level managers who only need to focus on the essential business KPIs necessary for them to make future decisions.
Executive-level reports are sometimes only one page long and represent a summary of the most relevant data or results achieved in a specific time period – most likely a month, quarter, or year.
Why Is Executive Reporting Important?
A survey from a couple of years ago showed that 74% of companies that reviewed their reports improved their overall performance. Not only does this apply to individual teams within a business, but it’s just as important for the executives, who need to know what’s going on at every level of the company.
Here’s why executive reporting matters:
Making the Right Decisions
Executives need to be in the know when it comes to the overall health of the company. That’s the only way for them to make the right decisions regarding the business’ future and make them quickly. Without a consistent and efficient reporting system, strategic planning cannot happen.
Identifying Issues and Risks
No matter how successful your strategy is, there will be times when some tactics fail or a factor that’s out of your control threatens your business. Executive reporting informs the C-suite about potential issues and risks timely, so they can react promptly and prepare to prevent them from becoming bigger.
Building a Better Company Culture
Executive reporting requires consistent and transparent communication between all levels of managers and team leaders. This way, you can avoid many misunderstandings and problems, and build trust between upper and middle or lower-level management, which contributes to stable professional relationships between everyone in the company and helps build a strong company culture.
Understanding Your Workflow
Sometimes, your reports will be meant for the managers of another business – new clients, potential investors, or partners. An executive report helps them understand how your company works and what your processes look like since they don’t have the time to read comprehensive business documentation, nor do they need all that data.
When Should You Use Executive Reporting?
Executive-level reporting comes in handy on several occasions. In fact, it’s useful in any situation in which you need to summarize a lot of data in a few crucial segments that will allow a manager to create an actionable plan based on the report.
Other than having regular reporting meetings that will occur, for example, quarterly or annually, here are several examples of when you should use executive reporting.
- If there’s an issue that requires immediate attention from the senior management.
- If lenders require seeing a summary of your business plan.
- If your company is negotiating with new potential investors.
- If you’re onboarding new clients or customers who need to know about your workflow.
- If there’s an opportunity to scale or meet any business goals faster.
- If a particular area of the business imposes a risk for the whole company.
- If there’s an upcoming challenge or opportunity that the management needs to prepare for.
How to Determine the Right Executive Report Format?
Not every executive-level report will look the same. The formatting, choice of data, and structure depend largely on the purpose of your report and who you need to prepare it for. If presenting your business plan to lenders, you will need to craft your report in one way, while your new clients will require a different format.
However, there are a few guidelines you should follow regardless of who you’re writing for.
Consistency: Do you have in-house documentation formatting rules? If so, make sure you consistently apply the rules to executive reports. And if not, you can make your own guidelines to make the document look professional, organized, and readable. Whatever the case in your company, make sure you use the same font, spacing, and other elements in every report you create.
Length: Whether it’s a one-pager or the purpose of the report requires it to be a tad longer, bear in mind that this type of reporting needs to be as concise as possible. That means only the key metrics, KPIs, and evaluations should be included. At the same time, you need to include all the data necessary for the executives or clients to make a decision. Some professionals recommend making the executive report up to 10% of the original documents.
Independence: Although an executive report is a summary of a more comprehensive document, a manager should be able to read it without needing to consult the original document. That means it shouldn’t include any data left unexplained or any new information you don’t have the room to elaborate on. Executive reports shouldn’t contain new data or materials that are not included in the original paperwork.
Tone: The tone and the terminology you’re using may differ depending on who you’re reporting to. If you’re documenting your processes to your superiors, you are able to use jargon and terminology that you know the managers will understand. However, if you’re writing for new clients and customers who may not be familiar with your industry, make sure you use natural language comprehensible to them. Always make sure you adjust the report to your audience.
Structure: Great reports start with a summary – go over the key points of the report so the person reading it immediately gets familiar with the topic. Use bullet points and short sentences and paragraphs to make the report readable and easy to follow. At the end, add evaluations and recommendations in a short, coherent conclusion.
Contents: Your executive report should cover the key points of the longer document clearly and concisely. Make sure all the answers you present in the executive report are based on data rather than on assumptions and don’t include any data that may seem important, but doesn’t actually contribute to the main goal of the report.
What Should an Executive Report Include?
Writing an executive report may feel challenging because you need to find a balance between what the managers want to read and what they need to know. On top of that, you need to use the right formatting and make sure the report isn’t too comprehensive.
It may not be easy to squeeze all the data you consider relevant in a one-page report, but the following section reveals the information your report should contain to be truly effective.
What Executives Want to Know
There may be a slight discrepancy between wants and needs in the case of executive reporting. Managers are sometimes more interested in specific information without being patient enough to hear about the data they actually need to know. When you bear this in mind, it’s easier to prepare your reports and be ready to discuss them in a meeting.
Here’s what executives want to know.
Best and worst results: Although executives will want to hear about the best and the worst results, steer clear from extremes.
Sometimes, a business will have immediate success, and the revenue will skyrocket in a few months. Sometimes, you’ll be facing a huge failure, but these extremes are unlikely to be your reality every day. Executives can sometimes obsess with these best and worst days, and miss the opportunities that lie somewhere between.
Make sure the report pulled from your performance dashboard highlights the data that has a critical and long-term impact on the businesses, rather than these isolated cases of high or low performance.
Money talk: Some executives prefer to talk about cost savings and cuts, while others get excited about revenue and growth. The first ones typically run public companies looking for ways to save money and decrease expenses, while the second ones usually work in fast-growing startups.
However, money isn’t everything, and there is a lot of useful data to be found between cost-cutting and revenue growth. When writing a report, you should keep a balance between the money-talk and other relevant KPIs.
Pro Tip: How to Stay on Top of the Financial Health of Your Business
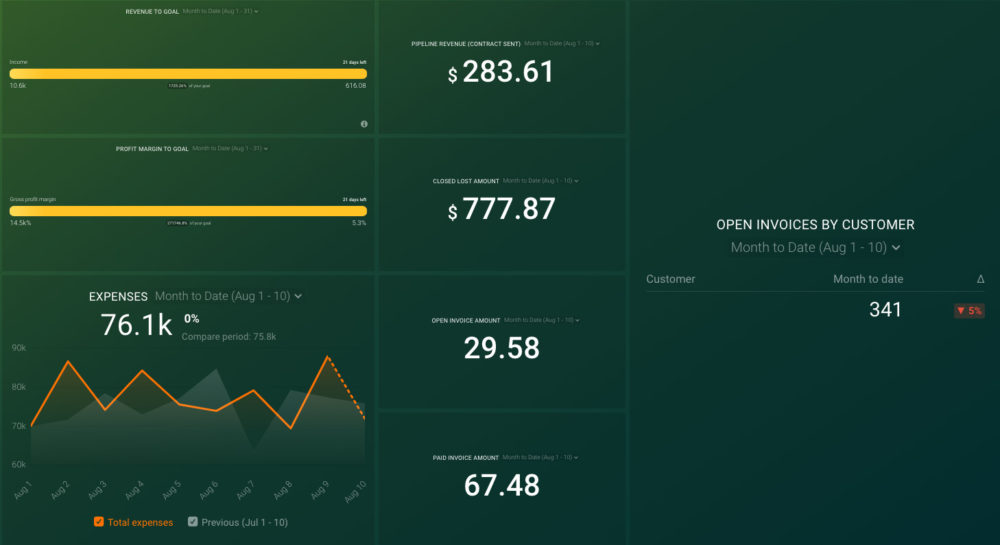
Do you own and manage a small business? Then you know how much of a struggle it can be to stay on top of the financial health of your business on a daily basis. Now you can pull data from QuickBooks and HubSpot’s CRM to track your key business metrics in one convenient dashboard, including:
- Open deals and deal amounts by pipeline stage. Get sales data directly from your HubSpot CRM and track deals, deal amounts, deal stages, and dates from your sales pipeline.
- Key financial data. Track gross profit margin, open invoices by amount and by customer, paid invoices, expenses, and income from QuickBooks.
Now you can benefit from the experience of our HubSpot CRM and QuickBooks experts, who have put together a plug-and-play Databox template that helps you monitor and analyze your key financial metrics. It’s simple to implement and start using it now!
You can easily set it up in just a few clicks – no coding required.
To set up the dashboard, follow these 3 simple steps:
Step 1: Get the template
Step 2: Connect your HubSpot and Quickbooks accounts with Databox.
Step 3: Watch your dashboard populate in seconds.
What everyone thinks: In reporting meetings, managers usually want to give everyone attending a chance to share their opinion. That’s considered common courtesy, and it’s generally a good thing, but executive-level reporting meetings need to be concise and to-the-point, just like your report.
Not everyone can equally contribute to every meeting, and that’s expected. To make the meeting effective, it’s critical for everyone involved to be present, but they don’t all need to speak – only those who are directly related to the issue in question.
The same goes for crafting the report – it should be one person’s responsibility so it can be streamlined and written in one tone rather than several people using different voices and styles.
What Executives Need to Know
There are some things that you need to discuss in an executive meeting.
Meeting topic: Executive reporting meetings are the last place to waste time at. Senior management is usually so busy that they barely have the time to read the report, but if they don’t do so, the meeting can actually cost them more than if they had set aside time to prepare.
If they’re only getting familiar with the meeting’s topic and reading the report for the first time at the meeting itself, they’re wasting their own time and everyone else’s. That’s why it’s critical to send the report in advance and leave the managers enough time to get prepared for the meeting and make it truly productive.
Responsibilities: One of the primary rules of setting the right KPIs for a business is that they need to be assignable. That means that everyone involved gets to be responsible for tracking one or more relevant metrics that need to be measured. The same goes for the meeting aftermath. Executive reports should clearly outline who will be in charge of the recommended actionable steps after the meeting, as well as the details on the follow-up.
Multiple goals: The executives don’t look at different departments and functions separately, but at the business as a whole. They need to know about all lower-level goals and strategies that affect the high-level business goals directly. That’s why the report needs to encompass different goals, perspectives, and contributions made by different departments over a specific time period.
What Is an Executive Dashboard?
An executive dashboard is a reporting tool that provides an at-a-glance overview of a company’s high-level KPIs that executive managers can later act on to drive further success or fix potential issues.
Such dashboards are actually data visualization tools that display all the relevant metrics consolidated in one place. They are an excellent addition to executive reports since a written report doesn’t include any graphics, illustrations, or charts. An executive dashboard can supplement the report in a way that provides deeper insight into the data provided in the summary.
Benefits Of Executive Reporting & Dashboards
Executives, regardless of how busy they may be with their own high-level processes and tasks, also need to know what’s happening with their teams on the operative level. When everyone in the company is kept in the loop, it’s possible to identify problems and risks, as well as trends and opportunities, as soon as they appear and react promptly. Executive dashboards allow them to do this quickly.
Executive reporting and dashboards also facilitate the decision-making process for the executives, since they’ll be sure their choices and forecasts are based on real and accurate data. And not only are you able to collect this data in real-time, but you can pull it from multiple sources into a single dashboard, where you can create visuals that will help you compare your performance to the last quarter’s, for example.
When you upgrade your executive report with a chart or table, you make it even more accessible and easier to act on. Summarizing the most important information, which may sometimes be complex, using visualization tools helps the executives:
- Understand the data better
- Identify strengths and weaknesses
- Increase teams’ productivity and engagement
- Improve internal processes
- Grow revenue
Best Practices In Executive Dashboard Reporting
Using illustrations, graphs, tables, and charts is highly recommended in executive-level reporting. And what are other best practices in creating executive dashboards you should know about?
- Adjust the Report to Your Audience
- Choose the Right KPIs
- Inform Your Team
- Customize the Dashboard
- Integrate All Your Platforms
- Create a Story
Adjust the Report to Your Audience
Keep your audience in mind when writing an executive report. Senior managers and potential investors are two very different target groups who will need different information about your business.
Exploring your target readers before you create the report is worth it – you’ll understand better what their objectives and interests are, and it’ll help you present the right data in the right way. You may even speak to the managers directly to learn more about their goals and priorities.
Choose the Right KPIs
Getting the KPIs right is always the number one concern within companies. Without these, you can’t have the right performance measurements. These KPIs need to be specific, measurable, assignable, relevant, and time-bound, and they should reflect the company’s priorities. Executive reporting isn’t the right place to go too much into detail with every KPI each of your departments has.
Also, make sure the KPIs are up-to-date. Even the high-level KPIs are occasionally revisited and adjusted if deemed necessary.
Inform Your Team
Even if there’s one person in charge of writing the report, the whole team should know how the process of executive reporting works.
Being transparent about this process is especially important when collecting the data: if your team knows the system inside out, they’ll know what metrics to track and pay additional attention to.
Customize the Dashboard
Dashboards are only helpful if they’re well-organized and free of clutter. Choose your metrics wisely and don’t overload the dashboard with unnecessary data that will drive your attention away from the important stuff.
One of the most efficient practices is to create a dashboard template that you can later edit and adjust to different purposes of your executive report. That will save your time and let you focus on the core elements of the report rather than build the dashboard from scratch every time.
Integrate All Your Platforms
You are probably using different types of software to collect the necessary data: website analytics tools, project management tools, CRM systems, and more. To craft your report, you need to pull the data from each one.
But that may take too long, so using software integration solutions may be a lifesaver. By connecting all your systems, you’ll make sure your data is accurate and reliable, ready for analysis and report writing.
Create a Story
Just because an executive is going to read your report, it doesn’t mean it has to sound dry. Your report should tell a story about your business strategy and its performance, so don’t avoid using a compelling narrative to deliver the data. It’ll be an attention-grabbing read and easier to follow than a bunch of numbers and percentages put together.
Executive Dashboard Examples
You now know in theory what a great executive report should look like. However, we’d like to share a few dashboard examples to help you get started with your own.
- Management KPI Dashboard
- Executive Financial Dashboard
- Financial Overview Dashboard
- SaaS Management Dashboard
- Sales KPI Dashboard
Management KPI Dashboard
How many customers downgraded their subscription this month? What is your churn rate? What’s your MRR? You can easily track all of this data by setting up this Stripe MRR & Churn dashboard template – it helps you track the number of customers you have at any given time. You can browse more KPI dashboards here.

Executive Financial Dashboard
How many open invoices do you have? How much did you get from your paid invoices? You can track all your paid invoices, find out how many pending ones you have, and learn if you’re on the right track towards your financial goals for the month by downloading this QuickBooks + HubSpot CRM Financial Performance dashboard template. You can browse more revenue dashboards or profit and loss dashboards here.

Financial Overview Dashboard
This Quickbooks dashboard template is an excellent addition to your financial executive report. It’s a well-organized dashboard that provides you with valuable insight into your bank accounts, your company’s cash flow, expenses, and sales so you can be in the know when it comes to your business’s financial health. You can browse more financial dashboards here.

SaaS Management Dashboard
You can track your SaaS revenue in a streamlined and neat way by using this Profitwell Revenue Trends dashboard template. It contains metrics such as recurring revenue, churn by type, MRR changes by type, and more, and helps you track your company’s growth over the year and identify strategies that drive the most revenue. You can browse more SaaS dashboards here.

Sales KPI Dashboard
HubSpot Sales Manager KPIs dashboard template is ideal for sales managers who want a streamlined overview of the relevant sales rep KPIs such as average deal size, new deals create, number of deals won, and more. This HubSpot integration answers many questions about your sales team’s success, like how much revenue you can expect from new deals created in the current month. You can browse more sales dashboards here.

Improve Executive Reporting with Databox
Traditional business analysis made us all think that executive reporting is a tedious process that takes up way too much of our time and resources. And actually, it really used to be like that – long nights of writing and extracting data, instead of focusing on the core tasks your role included.
However, with modernized and automated reporting software, reporting has become faster, more accurate, and more effective than ever.
An executive dashboard software like Databox enables you to collect data from multiple sources in one place, create all types of charts and graphs to get straightforward visualizations of this data and get it ready for analysis. Thanks to drag-and-drop features, it’s incredibly easy to build your own, customized reports and adjust them depending on the purpose.
Simply put, Databox provides you with powerful financial reporting software that supports your leadership by getting you the right data at the right time, in a well-organized and accessible manner.
We made reporting simple and enjoyable, so who could ever ask for more?
To find out just how simple it can really be, sign up for our free trial and replace reporting decks with automated dashboards today.


