


Table of contents
Sending the same report to everyone is a rookie move. Instead, you need to cater your report to the things that each key stakeholder cares about.
A great reporting strategy builds trust among internal teams, board members and investors and answers the following:
- Who are the key stakeholders that need to read this report?
- What’s the story you are telling with this report?
- What data do you need to include?
- What format conveys the narrative best (i.e. dashboard, deck, spreadsheet, etc?)
- When and how often should you send out your report?
In this post, we’re sharing the top tips to help you create a bulletproof reporting strategy, including:
- Get buy-in from all key stakeholders
- Make your reports interactive
- Keep it simple
- Alter your report format based on your audience
- Adjust your tone and language you use for different audiences
- Be concise

1. Get Buy-In From All Key Stakeholders
This all starts by making sure that everyone is aligned on your company’s mission, vision, and north star metrics.
“In my opinion, It is impossible to create strategic alignment among multiple stakeholders if external and internal communications departments do not operate together as a team,” says Edward Mellett of Wikijob.uk. “Furthermore, just 14% of employees are aware of their company’s strategy and goals. Employees can do a better job attaining their goals and understanding the broader business plan if internal communications perform a good job telling them about what external communications departments are working on.”
Then, work with each key stakeholder (or group of stakeholders) to identify the specific metrics and data they care the most about.
After all, if you are reporting to multiple in-house management teams, how you present the report will (and should) look different than the report you deliver to investors and board members or the report an agency delivers to the client’s senior management team.
Eden Cheng of PeopleFinderFree adds, “During internal communication with the employees, information flow might go upwards, downwards, diagonally, and horizontally within the company structure. On the other hand, during an external communication with the external audience, such as clients, the information exchange could go outside the company and remain within it. In brief, the best way to organize reporting to internal and external audiences is by two-communication method, transparent communication, consistency, emailing and newsletters, website content creation and target them, and social media.
Responding in a timely manner while reporting to different internal and external audiences is my approach for the best outcome. Let it be my internal employees or external vendors, I report to them once a week and make faster communication without fail.”
2. Make Your Reports Interactive
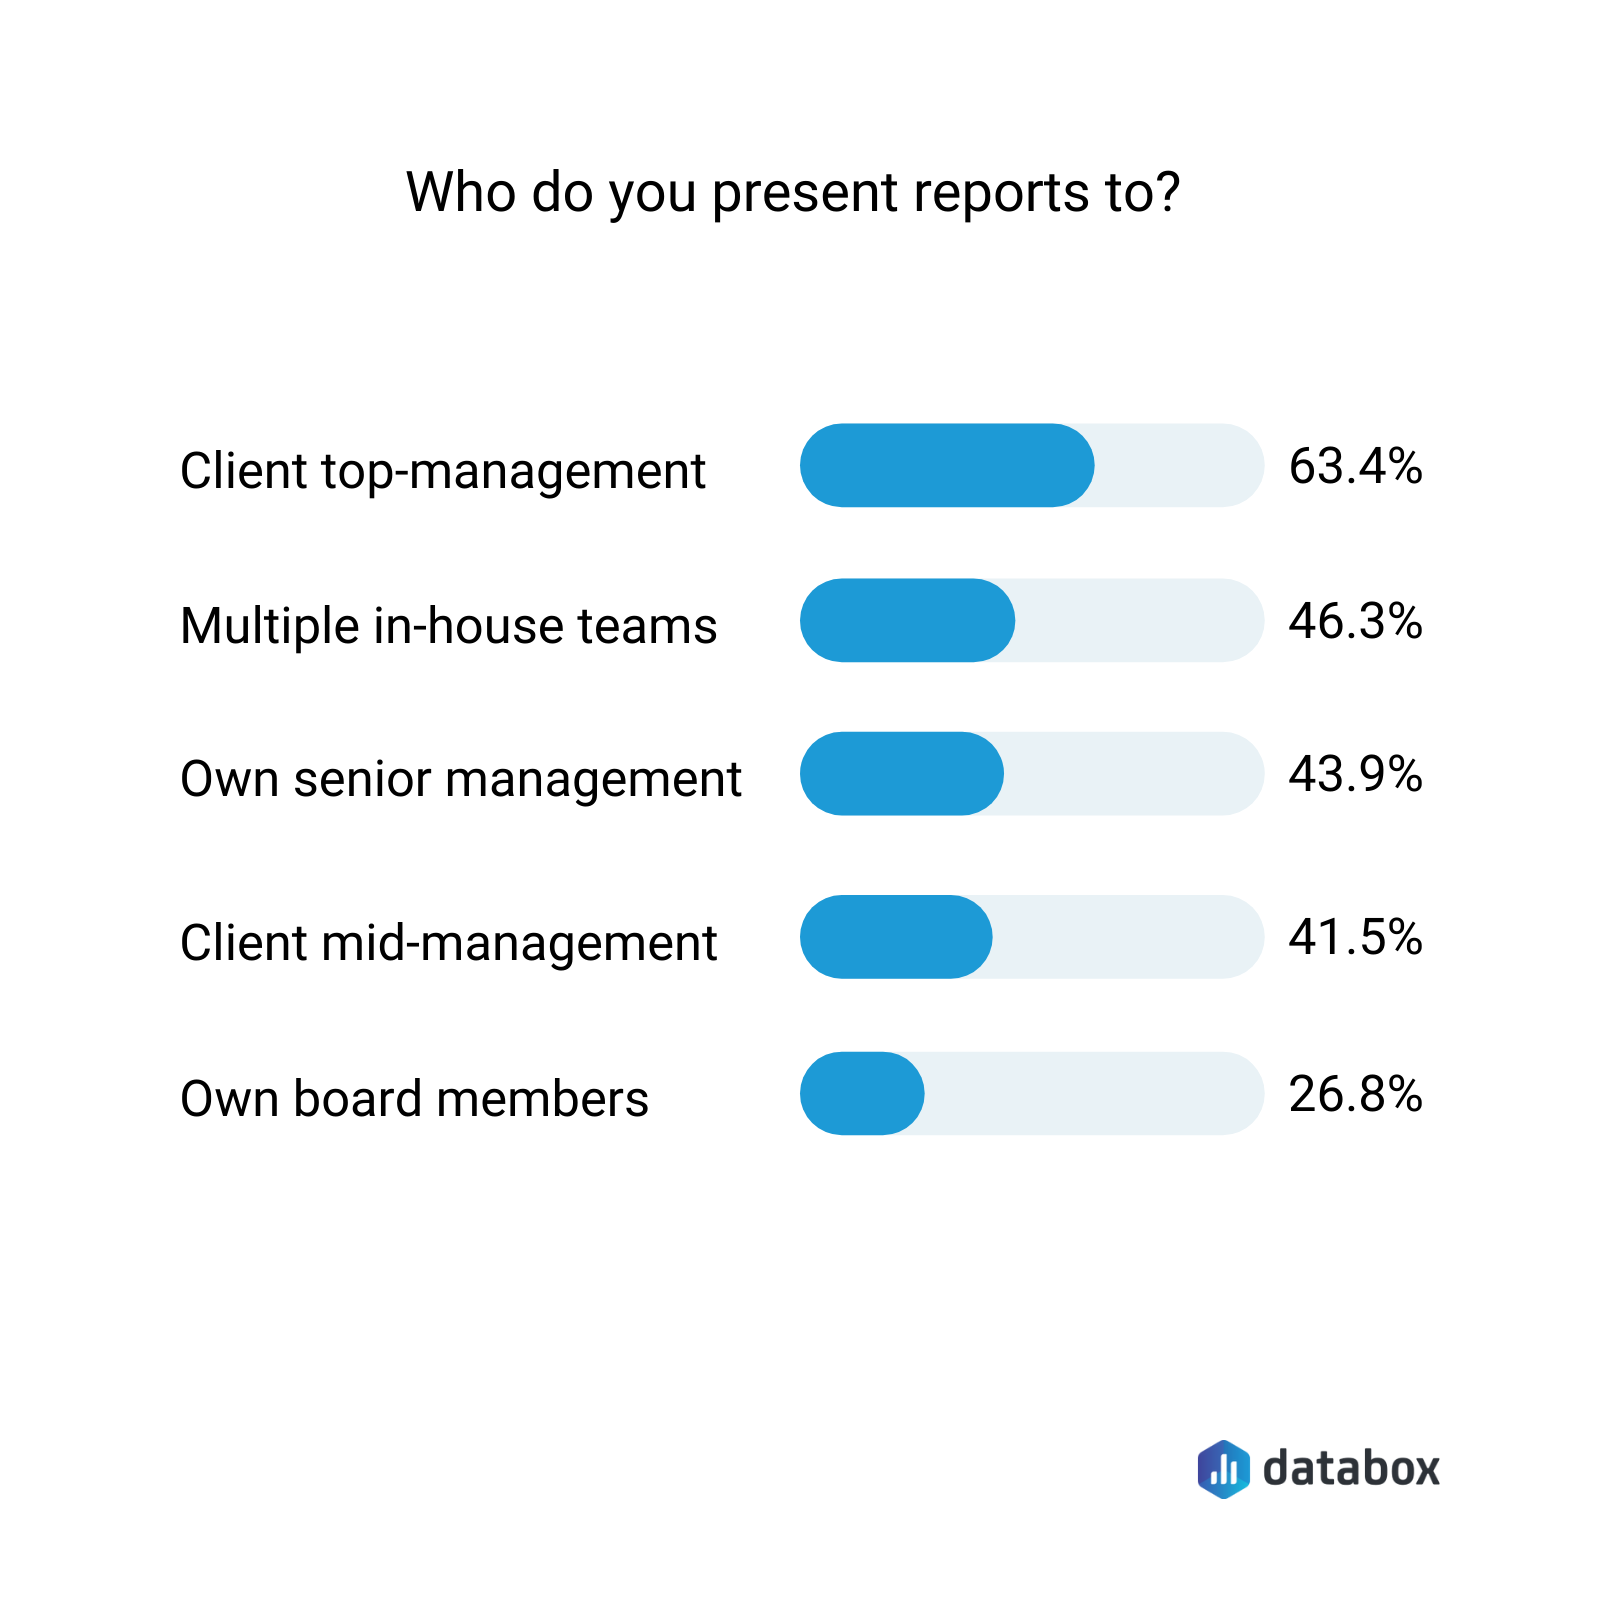
63.4% of our survey respondents use a centralized dashboard(s) as part of their reporting strategy. Also, live dashboards are one of the most popular report formats, according to Databox’s study about business reporting.
And there is a great reason for that. A well-designed dashboard is interactive and easy for a busy person to see what’s happening in a matter of minutes.

“Reports for multiple audiences are often most useful when created with interaction in mind,” says Lee Wilson of Vertical Leap. “This enables the layering of information, and more importantly the visualization of the data in more meaningful ways.
It’s necessary to lead the reports with impactful narrative, to make sure the salient messages are being reviewed by the right people. The use of summary and conclusion screens and dashboards can help theme the report and reinforce the key takeaways.”
PRO TIP: How Well Are Your Marketing KPIs Performing?
Like most marketers and marketing managers, you want to know how well your efforts are translating into results each month. How much traffic and new contact conversions do you get? How many new contacts do you get from organic sessions? How are your email campaigns performing? How well are your landing pages converting? You might have to scramble to put all of this together in a single report, but now you can have it all at your fingertips in a single Databox dashboard.
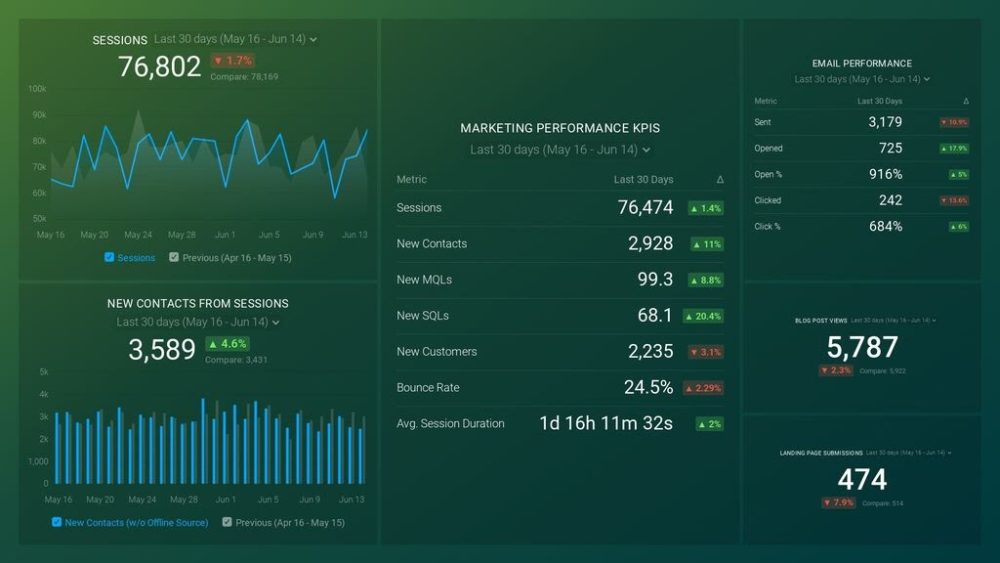
Our Marketing Overview Dashboard includes data from Google Analytics 4 and HubSpot Marketing with key performance metrics like:
- Sessions. The number of sessions can tell you how many times people are returning to your website. Obviously, the higher the better.
- New Contacts from Sessions. How well is your campaign driving new contacts and customers?
- Marketing Performance KPIs. Tracking the number of MQLs, SQLs, New Contacts and similar will help you identify how your marketing efforts contribute to sales.
- Email Performance. Measure the success of your email campaigns from HubSpot. Keep an eye on your most important email marketing metrics such as number of sent emails, number of opened emails, open rate, email click-through rate, and more.
- Blog Posts and Landing Pages. How many people have viewed your blog recently? How well are your landing pages performing?
Now you can benefit from the experience of our Google Analytics and HubSpot Marketing experts through a plug-and-play Databox template. It includes key metrics for tracking your leads and can be used as a standalone dashboard or as part of your marketing reports. You can try it during your free trial no setup headaches.
You can easily set it up in just a few clicks – no coding required.
To set up the dashboard, follow these 3 simple steps:
Step 1: Get the template
Step 2: Connect your HubSpot and Google Analytics 4 accounts with Databox.
Step 3: Watch your dashboard populate in seconds.
3. Keep It Simple
Another reason why centralized dashboards work well is that it makes it easy to distill the data simply.
If you are like most of the companies we surveyed, you have a lot of different reports from analytics, website marketing, and sales to paid ads, accounting, and more.
Good marketing reporting software that empowers well-designed dashboards, helps you present the most important business metrics in an easy-to-digest format.
For example, Dan Belcher of Mortgage Relief says, “A company generates a large number of reports. Internal and external users browse some reports to learn more about the business. In a firm, we are generally transparent to information such as profitability and stability. So, isn’t it vital to write a report that everyone understands?
As a business owner, I can say that when developing a report for multiple users, remember to emphasize understandability features. Keep it clear and avoid jargon phrases in your report so that everyone understands it.
When it comes to writing reports, I always go for “simplicity.” It’s well worth reading because it’s simple but full of depth. Filter the report’s data as well. Ensure that the report benefits or teaches everyone in the audience, not just a select few. Always strive for general understanding.”
4. Alter Your Report Format Based on Your Audience
Just like you adjust your sales and marketing messaging based on different personas, the same philosophy can be applied to your report messaging and formatting.
“Always pay attention to whom you’re reporting to,” says Andre Oentoro of Milkwhale. “If you are reporting to an internal audience, focus on providing as many details as you can. Whereas for external audiences, try to keep your reports short and sweet to prevent confusion and increase efficiency.”
Related: Internal vs. External Reporting: What Are the Differences?
Jordan Brannon of Coalition Technologies agrees, “Client-facing and internal reports differ in that client-facing reports are more geared towards addressing metrics or KPIs that clients care about (e.g., conversions, ROI, etc.). Those metrics are also important to us internally, but our internal reports are mostly focused on technical, actionable aspects that clients may not need to know.
Internal reports are also mostly focused on historical data and involve examining details in minutiae, especially when it comes to troubleshooting.
Moreover, reports for clients include explanations for technical jargon or issues that they may not be familiar with. We also reiterate data-driven strategies that we have created and implemented for them and show how effective they are.
Finally, we include conclusions and recommendations that are backed up by the data.”
Brandon Schroth, Nomad SEO adds, “When organizing reports for an internal audience, it’s important to keep in mind that the purpose of the data is to make decisions within the organization. It should include what was done, what problems or goals were addressed, results, and conclusions/recommendations.
When organizing reports for external audiences the data is focused on their specific needs and goals. You need to deliver information that highlights the purpose of the report and key takeaways.
If possible, avoid overly technical terms and instead use concise, engaging language. The report should be organized in an aesthetically pleasing way that directs the reader to the information that you’d like to stand out.”
For example, Janice Wald of Mostly Blogging says, “Internally, we share our income reports and set new growth goals. Externally, we share our metrics with prospective clients. These metrics include web traffic, Domain Authority, Domain Rating, and Alexa Rank. We share the number on our email list and our number of social media followers. We also share the awards we’ve won depending on the potential client. We might also share testimonials from happy clients.”
5. Adjust the Tone and the Language You Use for Different Audiences
It is not just the format and metrics you include, but also the language you use in each report.
“It’s crucial to adjust your reporting’s language and structure to the audience you’re speaking to,” says Dorota Lysienia of LiveCareer. “You will use a different approach for your team that knows the details of the project and is familiar with the methods and tools you’re working with. In that case, you can go deeper in your analysis and prepare reports that can benefit other team members.
However, such a level of analysis might be unnecessary for upper management. Here, you should explain the general picture of your performance and get other managers on board when discussing your future ideas. For that audience, it’s more important WHY you do certain things than HOW exactly you achieve them. “
For example, Michael Sena of Senacea adds, “A hands-on Operations Director may require real-time data presented in a way that helps them act quickly. At the same time, investors may prefer a high-level summary that shows quarterly trends with optional drill-down to more granular cases.”
6. Be Concise
Regardless of who you are presenting to, it is always a good idea to keep it as short as possible. The shorter the report is, the more likely someone will read it.
“The shortest good thing is twice as good,” says Natalia Brzezińska of Photo AiD. “If you can tell something in 50 pages, don’t tell it in 250. You don’t want to cram all your rhetoric into your report. And take it for granted that if you have produced a fantastic 400-page report, you may have already included the formula for eternal youth, which no one will read.
Related: Business Report: What is it & How to Write a Great One? (With Examples)
If the message is dense and confusing, the reader will give up, so keep it short, direct, clear, and easy to understand.
And if you want to be read by senior management, remember that you only have five minutes.
You need something simple, visual, and straightforward, where it is clear what your document brings to the table that was not previously known.
A picture is worth a thousand words. A report that you open and everywhere is text, more text, and only text will be much more tedious than one in which there is graphic material.
Be original and creative. Use photos, diagrams, data presentations, illustrative tables, diagrams, etc. But don’t overdo it. It’s a support, not a contest. Graphics and images are not only an aesthetic resource but also great cognitive support. They help visualize the ideas you want to show and make the document more attractive, easier to understand, and inviting your audience to read on.”
To sum it up, the best reporting strategy is simple, concise, and interactive. The best reports are also not one-size-fits-all documents. They take into consideration the specific metrics that each stakeholder(s) cares about.
Want to up-level your reporting strategy in minutes not hours? With more than 70 integrations, you can create reporting dashboards with Databox for free.


![How to Improve Agency Operational Efficiency [Insights from 40+ Agencies]](https://cdnwebsite.databox.com/wp-content/uploads/2023/09/14052320/agency-client-collaboration-1000x563.png)


