Uses one-click integrations:
-
 Shopify
-
 BigCommerce
If you don't use Shopify or BigCommerce, you can pull data from any of our 130+ one-click, native integrations or from spreadsheets, databases and other APIs.
Try this dashboard for free
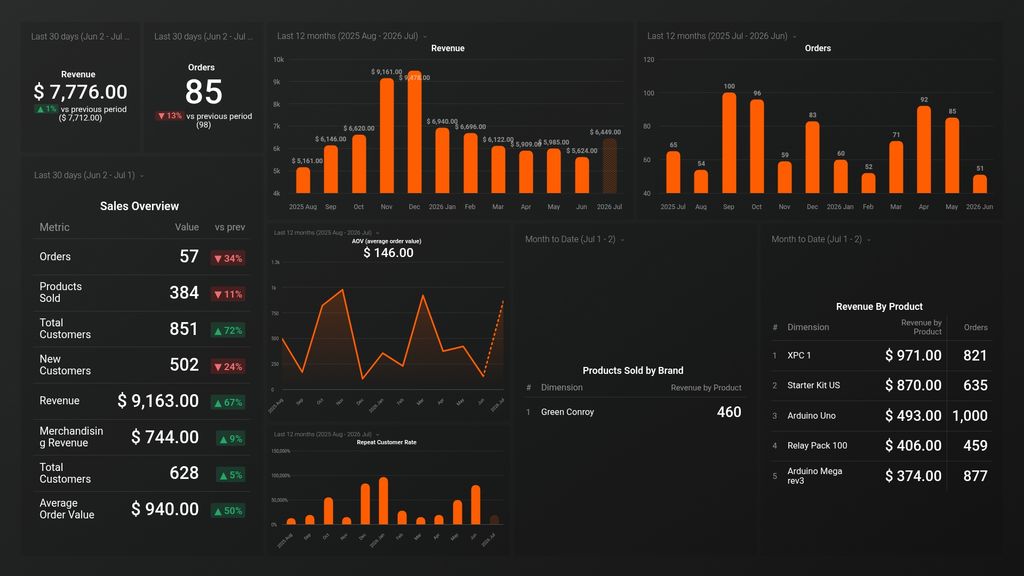
Shopify metrics included in this template
- Average Order Value
BigCommerce metrics included in this template
-
Merchandising Revenue
Merchandising Revenue is a metric that measures the total sales generated by a company from selling its products or services, excluding any revenue from other sources such as subscriptions or advertising.
-
Merchandising Revenue by Product
Merchandising Revenue by Product measures the total revenue generated by each individual product in a given period, providing insights into the sales performance and profitability of specific items in a merchandising business.
-
New Customers
The New Customers metric indicates the number of unique individuals or companies who have made their first purchase on your BigCommerce store (note that due to API limitations syncing for this metric can take longer than usual).
-
Orders by Product
The Orders by Product metric refers to the number of times a specific product has been purchased by customers on the BigCommerce platform.
-
Products Sold
Products Sold is a metric that measures the total number of units or items sold by a business within a specific time period. It helps businesses track their sales performance and understand the demand for their products.
-
Products sold by Brand
The Products sold by Brand metric on BigCommerce tracks and analyzes the performance and sales of products based on their respective brands, allowing businesses to gain insights into the popularity and effectiveness of different brand offerings within their online store.
-
Total Customers
Total Customers is a metric that indicates the overall count of unique customers who have made a purchase or engaged with a company's products or services.