Table of contents
Paid ads on Facebook, if done right, can put a lot of gas in the tank in terms of awareness and conversion. But it’s not cut and dried.
Knowing what to spend, how, and where— and understanding the metrics that come out of your campaigns— can make the difference between great ROI and great, big headaches.

So, when venturing into Facebook ads (maybe for the first time) or when expanding your reach through improved targeting and placements, where do you start and what do you track?
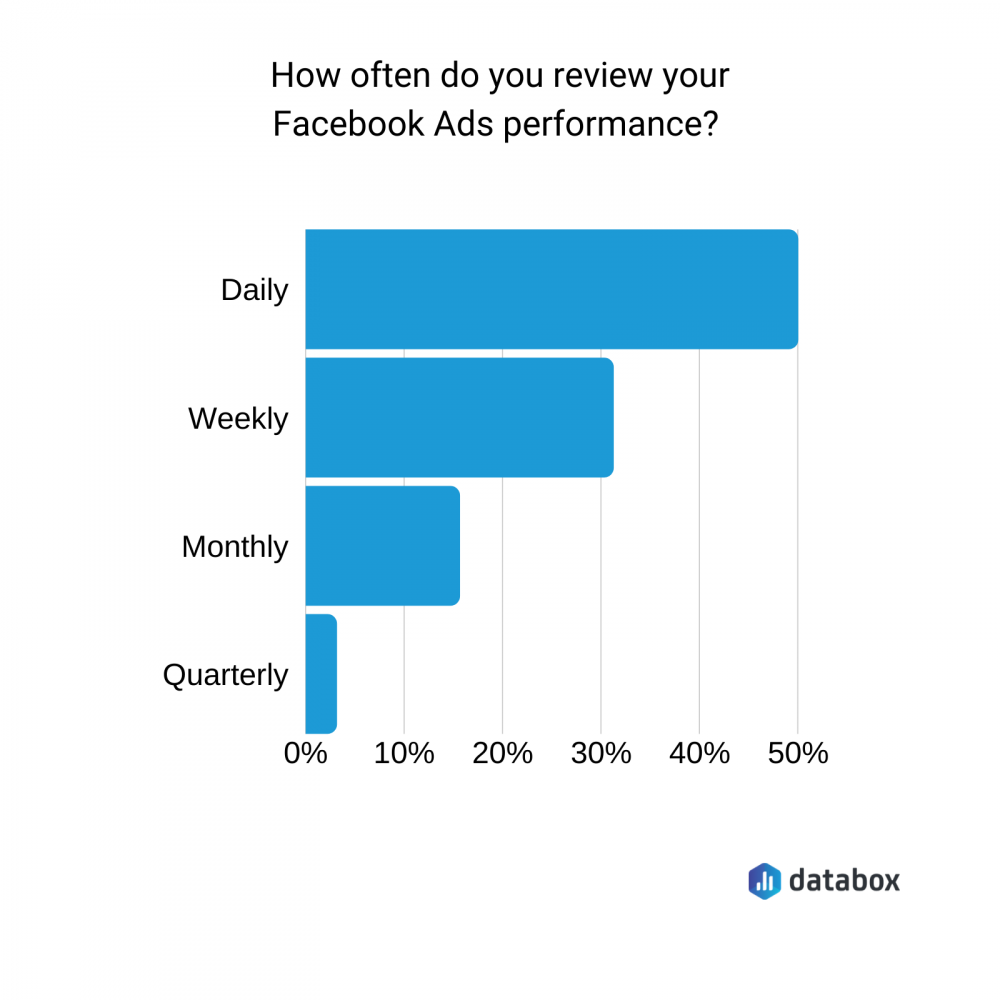
Furthermore, when we asked over 300+ companies in our study on Facebook ads, we learned that more than 60% of agencies monitor results daily and more than 50% of them reports on the results weekly, while 40% of SMBs monitors results weekly and 38% of them reports monthly.
We asked over 30 experts to weigh in on the metrics, tactics, tips, and tools they use to get the most out of their Facebook ad spend, make every impression go the distance, and use the resulting data to further improve their campaigns.
Below you’ll find a wealth of information on identifying and utilizing metrics, setting priorities, using tools within the Facebook Ads platform, and tracking revenue.
Each of the tips provided can help move you create a better PPC dashboard.
- Setting Objectives
- Organizing and Prioritization
- Ad Spend and Revenue
- Strong Metrics and Reporting Tools
- Quality Ad Design
- Targeting and Conversion
- Lookalike Audiences
To gain specific insights into one area listed above, click the link to be taken there, or scroll on to learn more about all these important tactics.
Setting Objectives
If you know where you’re going, you certainly more likely to get there, according to the wisdom put forth by several of our experts.
Melanie Musson of 360QuoteLLC kicks it off with this easy advice: “Keep your objective as the focus. Make sure your paid ads dashboard reflects how Facebook ads are helping you reach that objective.”
Use them as a sidecar to other data you’re analyzing, says Brooks Manley of Engenius, who says “Place goals and objectives alongside any data. This has been a massive help to our team in processing the metrics, graphs, and numbers on our paid search dashboard. It also saves time on questions such as, ‘Is this good?’ as doesn’t have to be asked.”
Christine Telyan of UENI Ltd also likes to “Keep it simple!” Says Telyan, “Choose the right events you want to track and limit your analysis to these events’ achievements, as well as primary metrics like Reach, Impressions and Clicks.”
Vaibhav Diwanji of E-INTELLIGENCE also uses this approach. “Before creating a marketing dashboard, make sure you have a set of objectives to reach out to your goal. First of all, you should understand current topline marketing activity or the latest trend, plan campaign execution by seeing metrics in the funnel brackets and identify the most expensive and effective ad sets.”
Getting the right perspective up-front adds value to your actions, says Priscilla Neto of MashMetrics. “From well-defined goals, you will have a much more assertive perception of what a good performance on Facebook Ads is. This is how you will be able to plan future improvement actions and not waste time with strategies based on guesswork or vanity metrics.”
PRO TIP: What’s the overall engagement of your ad campaigns?
Want to make sure your Meta ads are performing and trending in the right direction across platforms? There are several types of metrics you should track, from costs to campaign engagement to ad-level engagement, and so on.
Here are a few we’d recommend focusing on.
- Cost per click (CPC): How much are you paying for each click from your ad campaign? CPC is one of the most commonly tracked metrics, and for good reason, as if this is high, it’s more likely your overall return on investment will be lower.
- Cost per thousand impressions (CPM): If your ad impressions are low, it’s a good bet everything else (CPC, overall costs, etc.) will be higher. Also, if your impressions are low, your targeting could be too narrow. Either way, it’s important to track and make adjustments when needed.
- Ad frequency: How often are people seeing your ads in their news feed? Again, this could signal larger issues with targeting, competition, ad quality, and more. So keep a close eye on it.
- Impressions: A high number of impressions indicates that your ad is well optimized for the platform and your audience.
- Amount spent: Tracking the estimated amount of money you’ve spent on your campaigns, ad set or individual ad will show you if you staying within your budget and which campaigns are the most cost-effective.
Tracking these metrics in Facebook Ads Manager can be overwhelming since the tool is not easy to navigate and the visualizations are quite limiting. It’s also a bit time-consuming to combine all the metrics you need in one view.
We’ve made this easier by building a plug-and-play Facebook Ads dashboard that takes your data and automatically visualizes the right metrics to give you an in-depth analysis of your ad performance.
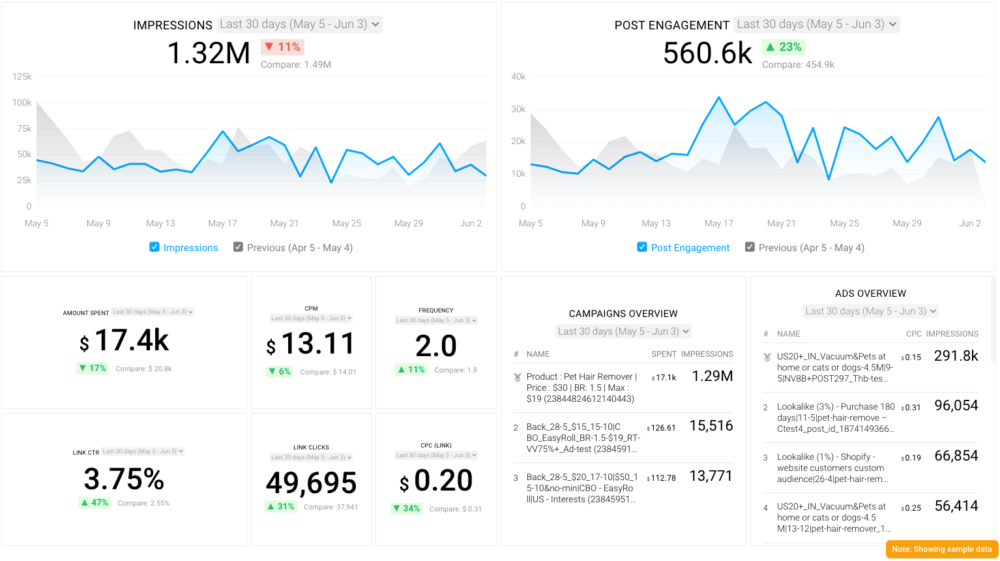
With this Facebook Ads dashboard, you can quickly discover your most popular ads and see which campaigns have the highest ROI, including details such as:
- What are your highest performance Facebook Ad campaigns? (impressions by campaign)
- How many clicks do your ads receive? (click-through rate)
- Are your ad campaigns under or over budget? (cost per thousand impressions)
- What are your most cost-efficient ad campaigns? (amount spent by campaign)
- How often are people seeing your ads in their news feed? (ad frequency)
And more…
You can easily set it up in just a few clicks – no coding required.
To set up the dashboard, follow these 3 simple steps:
Step 1: Get the template
Step 2: Connect your Facebook Ads account with Databox.
Step 3: Watch your dashboard populate in seconds.
Organizing and Prioritization
Well begun is half done, according to many of our experts who focus on thoughtful setup and prioritization of dashboards and information
For instance, Marissa Ryan of VisualFizz likes to set up dashboards to look at data in a few different ways, “Creating a FB dashboard can be helpful in tracking month over month progress. My best tip for creating a dashboard is to track all campaigns both individually and as a part of the greater campaign. This will allow you to know exactly which ad groups/audiences are performing most strongly. This will require a bit of mindfulness in structuring your campaign at the beginning, but once you have your ad groups and/or audiences broken out, you’ll be able to more deeply understand what is working and what isn’t at a glance.”
This method also works for Dawn Foster of D. Foster Marketing Consulting. “When creating multiple ad campaigns, naming conventions for each aspect is super important. It allows you (and your team if working with one) to have a clear understanding of what the purpose, initiative, campaign, objective, etc. is for each initiative.”
Keeping it brief is one key to keeping it organized, says Jeromy Sonne of Moonshine Marketing. “The biggest tip I can give is to be concise. So many marketers I see want to impress clients by doing huge data dumps with tons and tons of different metrics and charts to show lots of nice green arrows going up. When it comes to building an ads dashboard tell the story of the KPI and the goal you’re working towards, give some context, and nothing more. Brevity is the soul of great dashboard building.”
Jasmine Hippe of Augurian agrees, saying, “Keep it simple. Start by writing a list of the Facebook ads questions you hear most often from your team, then using those questions as headings build visuals that clearly and directly answer those questions.”
Christine Telyan of UENI also invites us to “Keep it simple! Choose the right events you want to track and limit your analysis to these events’ achievements, as well as primary metrics like Reach, Impressions, and Clicks.”
Remember, if some are good, more is not always better, says Kazi Shamun Hassan of COdesign. “The Facebook dashboard offers plenty of data points for the user to analyze. While this might sound like a good thing, at first sight, keeping track of too many metrics can make you lose sight of your main objective. I believe in the ol’ ‘less is more’ mantra and try to keep my dashboard as clutter-free as possible.”
Hassan adds, “Additionally, I try and focus only on one metric for my ads. So if a certain ad has engagement objectives, the CPR is of utmost importance and other stats can be ignored.”
Neat and tidy also works for Max Runge of RocketWM. “When I create a Facebook ads dashboard, I always make sure that the names of the campaigns, ad sets, and ads give everyone in our team a quick overview of what is going on in this campaign. So if an account manager must take over a client from another account manager, it just takes less time to get an overview.”
And one quick housekeeping item from Chelsea Brown of Digital Mom Talk. When setting up your boards, “make sure the company is the owner of the Facebook Dashboard. If you have your VP of Marketing, CEO, Marketing Company, etc. set up your Facebook ads dashboard, your company will lose all of its ad data and analytics and can also suffer a major security breach.”
Ad Spend and Revenue
Look after the pennies, and the dollars will look after themselves. This is especially true when paying to run your ads on the platform.
When serving clients, Aristide Basque of SH1FT reminds us to show what they want to know. “Make sure you have ad spend/revenue, that’s what most clients want to see.”
James Pollard of The Advisor Coach keeps that very simple for their own analysis, “Set it up so you can focus on dollars in and dollars out. How much are you spending and how much are you getting back? Lots of people set up their dashboards to show them how many clicks, views, impressions, etc. they’re getting but none of that matters. If you were to look at my dashboard, you would be shocked at how simple it is. You would see ‘amount spent’ and ‘ROAS’, which is return-on-ad-spend.” Why? Explains Pollard. “Anything other than that doesn’t really matter.”
You have to know what’s going into the ads when it comes time to track ROI, reminds Tabitha Young of 30 Degrees North. “Don’t forget to track your ad spend! I’ve seen so many clients not tracking their ad spend on their reporting. Therefore, when they go back to do any auditing or analytics they don’t have a good idea of what they were spending on Facebook ads.”
And be sure you know how the money is coming in, in order to control your margin, says Rad Basta of Reportz. “If you are an agency owner, the most important thing to have in mind is how you are charged. If you charge your clients with a monthly retainer, then you’re good to go. If perhaps you charge your clients a markup for the ad spend, then it is very useful to include the markup in the widget that shows the ad spend. We have that feature in our tool.”
Strong Metrics and Reporting Tools
Having the right reporting tools and the knowledge to look deep into the data from your marketing dashboard software puts you one step closer to success with your ads, according to many of our respondents.
Andrea Moxham of Horseshoe + co. says “One of the most important and crucial metrics to track using a social media dashboard is the Engagement Rate. It includes the number of people that clicked your link, commented, liked, and shared your content. You can segment this Facebook KPI by post type such as video, photo, gif, etc. This allows you to understand which type of ad format performs best to steer the direction of your advertising and organic social media strategy.
Dylan Zsigray of Kiwi Creative examines the funnel from top to bottom when analyzing metrics. “We use Databox to display our clients’ Facebook Ads performance. When we create these dashboards with this custom dashboard software, we work to display the funnel of high-to-low-tier stats. We begin with the number of impressions and total reach and going down to how the total budget was allocated between different ad groups and ads. We ensure our Databoard flows from left-to-right. This gives our clients a full picture of how their Facebook Ads campaigns are performing and identify areas that can be further optimized. An example of this is A/B tested ads.”
Even individual metrics have data to slice, says Jeremy Cross of Team Build NYC, who says, “For your ads dashboard, consider adding a subjective column for ‘degree of targeting’ It can be easy with ads to focus on only the numbers: CTR, CPC, and similar. Instead, when you add subjective columns you can learn more about what works in your specific industry. By following this method, we’ve improved our CTR on certain ads by as much as 200%.
Editor’s note: Get 3 free pre-built Facebook Ads dashboards, or create a custom dashboard with Databox now.
PRO TIP: What’s the overall engagement of your ad campaigns?
Want to make sure your Meta ads are performing and trending in the right direction across platforms? There are several types of metrics you should track, from costs to campaign engagement to ad-level engagement, and so on.
Here are a few we’d recommend focusing on.
- Cost per click (CPC): How much are you paying for each click from your ad campaign? CPC is one of the most commonly tracked metrics, and for good reason, as if this is high, it’s more likely your overall return on investment will be lower.
- Cost per thousand impressions (CPM): If your ad impressions are low, it’s a good bet everything else (CPC, overall costs, etc.) will be higher. Also, if your impressions are low, your targeting could be too narrow. Either way, it’s important to track and make adjustments when needed.
- Ad frequency: How often are people seeing your ads in their news feed? Again, this could signal larger issues with targeting, competition, ad quality, and more. So keep a close eye on it.
- Impressions: A high number of impressions indicates that your ad is well optimized for the platform and your audience.
- Amount spent: Tracking the estimated amount of money you’ve spent on your campaigns, ad set or individual ad will show you if you staying within your budget and which campaigns are the most cost-effective.
Tracking these metrics in Facebook Ads Manager can be overwhelming since the tool is not easy to navigate and the visualizations are quite limiting. It’s also a bit time-consuming to combine all the metrics you need in one view.
We’ve made this easier by building a plug-and-play Facebook Ads dashboard that takes your data and automatically visualizes the right metrics to give you an in-depth analysis of your ad performance.
With this Facebook Ads dashboard, you can quickly discover your most popular ads and see which campaigns have the highest ROI, including details such as:
- What are your highest performance Facebook Ad campaigns? (impressions by campaign)
- How many clicks do your ads receive? (click-through rate)
- Are your ad campaigns under or over budget? (cost per thousand impressions)
- What are your most cost-efficient ad campaigns? (amount spent by campaign)
- How often are people seeing your ads in their news feed? (ad frequency)
And more…
You can easily set it up in just a few clicks – no coding required.
To set up the dashboard, follow these 3 simple steps:
Step 1: Get the template
Step 2: Connect your Facebook Ads account with Databox.
Step 3: Watch your dashboard populate in seconds.
Keep the important things front and center, says Dorian Reeves of SH1FT, who recommends readers ‘Make sure you have your three most important metrics appear as soon as you get on the dashboard to be able to scan quickly and get a good idea of the performance right away.”
If you want to know where your audience is hanging out, one thing to look for is what device they’re hanging out on. “Noelle Del Grippo of Sagefrog Marketing Group shares: “One metric that we use on our Facebook ads dashboard is clicks by device platform. This metric gives insight to your audience. It shows you what device your ads are being served on and on what device your audience is interacting more frequently, whether its desktop or mobile. Looking at this metric you may notice that the majority of your clicks are coming from mobile devices. Using that insight, ensure that your campaign is optimized for mobile. Is your landing page mobile-friendly?”
Knowing what metric your chasing in your social media dashboard software is important, reminds Dan Young of Loud Digital. “Keep it simple stupid! Confirm KPIs with the client and make sure the dashboard reports performance clearly and concisely there’s no reason to have more than a few pages to showcase performance. The most key section for a lot of our own clients is the day-by-day report showcasing key metrics in a simple table format.”
William Chin-Fook of MyWifeQuitHerJob.com agrees. “Add your specific custom columns based on your team’s KPIs. For example: If your goals are lead generation, maybe you want to customize your columns for ‘Results, Impressions, Deliveries, Clicks, Amount Spent and CTR’. If you’re trying to increase brand awareness a mixture of ‘Reach, Impressions, Delivery, Amount Spent and Relevance Score’ may be perfect for your campaign. Let your campaign goals dictate how you set up your specific columns in Facebook Ad Manager dashboard.”
The best place to analyze your Facebook ad data… isn’t on Facebook, says Jaimmie Riley of Bone and Bred. “Facebook is a very powerful advertising tool, however, it’s ads dashboard lacks analytic insight. As a result, make sure you are sending all relevant data to Google Analytics (through proper UTM) or other third-party marketing tools (Like Marketo, Voluum) to measure and analyze the full pathway to conversion. If your KPI is lead generation, for example, Facebook will attribute the lead to the ad whether it is first touch or last touch which can make it hard to analyze results and develop the best-integrated strategy for your digital campaigns.”
We all do it. (That is, sneak a peek at clicks or impressions for some harmless fun). But while, “It’s ok to look at ‘vanity’ metrics like clicks or CPM (Cost per 1,000 metrics),” Matt Morin of Fetch Funnel says, “be sure to focus mostly on the money metrics like Cost Per Purchase for e-commerce companies, or Cost Per Lead for lead generation campaigns. It’s harder to fudge these numbers and they relate much more directly to the bottom line of your campaigns.”
Personalization isn’t just for marketing, says Liam Barnes of Directive, who recommends, “Regardless of what kind of dashboard you are working with, it should always be customized for whom you are reporting it. Because most people are worried about ROI, I would recommend including metrics like ROAS, CPC, Ad Spend, and Revenue.”
Quality Ad Design
Ads are more likely to go from impression to conversion if they are well-crafted, engaging, and eye-catching.
People don’t love the idea of being sold to, so craft your ads to avoid this feeling, says Bipin Chand of MakeWebBetter. “Use storytelling in your advertising campaigns and don’t make them look like ads.”
Lisamarie Monaco of InsuranceForBurial.com reminds us that the future is mobile, and your ads should be as well. “Create a Facebook ad that is mobile user-friendly. Your users are on the go. 90% of them will fall off if your content does not load quickly and efficiently while they are using their mobile devices. Keep your ads simple for the user to read, load and connect with. I assure you by doing this, will give you higher conversion rates!”
Targeting and Conversion
Refining your aim with targeting, and keeping an eye on your conversion metrics, proved to be the most important consideration for a fair number of experts.
James Robinson of Iconic Genius reminds us to look to relevancy. This metric gives marketers a scorecard to understand how well their ad is being received by audiences. Says Robinson, “this is most important to me because it gives me an idea of how well my ads are doing. A relevancy score is made up of 3 different factors: Targeting (How well do you know your audience?), ad quality (How much are people paying attention to it?) and conversion (How well is the ad performing the objective?)” Says Robinson of their own ad tracking efforts, “As long as I know the relevancy everything should fall in line based on that.”
Lookalikes
If you want similar results, you may find it by looking into a similar audience, says Samantha Odo of Precondo, who coaches us to use this powerful tool in order to reach those who might best resonate with our message. “Many times businesses like to connect with their old customers— only or those who are brand loyal. But I believe it restricts your business growth. No matter how big purchases they make or how long they are associated with your business, you need to keep other audiences in your category as well. This will allow them to choose you over others.”
Says Odo, “I suggest choosing Lookalike audiences that give you a way to reach a new audience that otherwise is beyond interest or behavior targeting. Lookalike Audiences is a great way to target people who are similar to people who already interact with your business—meaning either they are your customers or are likely to be interested in the products and services you offer.”
Also, Odo reminds us, “if you don’t have a large list to create a Custom Audience from your customer list, you can create lookalike audiences based on a Custom Audience of people who have visited your website, shown interest in your products/services or who already like your Facebook Page.”
With these tips in mind, you’ll be able to make the most of the visible data within Facebook ads, keep your dashboards neat and useful, and use the data to make informed decisions about your ad spend, targeting, and more. We think these insights will give readers the edge in this increasingly busy ad hub.
Hungry for a little more? Check out this Data Snack for insights on creating performance dashboards for insights you can take to the bank.
All ready to create your own Facebook Ads dashboard? Then look no further than Databox’s business KPI dashboards, which are optimized for all your devices.